

Nifty 50 Stocks List with Weightage 2026
⚡ Quick Summary
- Reliance Industries holds the highest weightage at ~9.52% in Nifty 50 as of June 2026.
- Financial Services sector dominates with approximately 33–34% of total index weight.
- September 2025 rebalancing brought in IndiGo and Max Healthcare; Hero MotoCorp and IndusInd Bank exited.
- March 2026 semi-annual review: no constituent changes; weightages adjusted by market cap.
- The index currently trades near the 23,300–24,000 zone as of early June 2026.
Table of Contents
- What Is the Nifty 50 Index?
- How Is Nifty 50 Weightage Calculated?
- Nifty 50 Stocks List with Weightage 2026 (Full Table)
- Top 10 Nifty 50 Stocks by Weightage
- Sector-Wise Weightage Breakdown
- Why Certain Sectors Dominate – Fundamental Analysis
- 2025–2026 Rebalancing: What Changed?
- How to Invest in the Nifty 50
- Frequently Asked Questions
What Is the Nifty 50 Index?
If you have spent even a few months following Indian markets, the name Nifty 50 is impossible to escape. It appears on every business news channel ticker, in every mutual fund factsheet, and in practically every conversation about the Indian economy. But what exactly is it, and why does it matter so much?
The Nifty 50 is the flagship benchmark index of the National Stock Exchange of India (NSE). It tracks the performance of the 50 largest and most liquid publicly listed companies in the country, selected on the basis of their free-float market capitalisation. The name itself is a blend — “Nifty” from National Stock Exchange Fifty, and “50” denoting its 50 constituents.
Think of it as India’s equivalent of the S&P 500 in the United States. Just as the S&P 500 gives you a real-time pulse of the American economy, the Nifty 50 tells you where India’s corporate sector stands on any given trading day. Fund managers use it as a benchmark. Retail investors use it to track their portfolio’s performance against the broader market. Exam candidates across finance courses — from NISM to CFA — are tested on it. And every single quarter, lakhs of systematic investment plan (SIP) rupees flow into index funds and ETFs that simply replicate it.
What makes the index particularly interesting — and this is why understanding its weightage structure is so crucial — is that it is not an equal-weight index. Every company inside does not carry the same influence. A 1% move in Reliance Industries will shift the index far more than a 1% move in Divi’s Laboratories. That is the essence of a market-cap weighted index, and it is exactly why the Nifty 50 stocks list with weightage matters.
How Is Nifty 50 Weightage Calculated?
Before diving into the actual numbers, it helps to understand the mechanics behind how a stock earns its weight in the index. The Nifty 50 follows the free-float market capitalisation method.
Here is what that means in plain terms: instead of counting the total shares of a company, only those shares that are freely available for trading in the open market are counted. Shares held by promoters, locked-in institutional blocks, or government holdings are excluded. This makes the index more reflective of what ordinary investors can actually buy and sell.
The formula is straightforward:
A company’s weightage in the Nifty 50 = Its free-float market cap ÷ Total free-float market cap of all 50 companies × 100
So when Reliance’s share price rises, its free-float market cap increases, and its weight in the index goes up accordingly. This is a self-reinforcing mechanism — large companies growing larger naturally increases their influence on the index’s day-to-day movements.
The index is rebalanced semi-annually — the cut-off dates for review are January 31 and July 31 each year. Results are typically announced about six weeks later and become effective by late March and late September respectively.
Nifty 50 Stocks List with Weightage 2026 (Full Table)
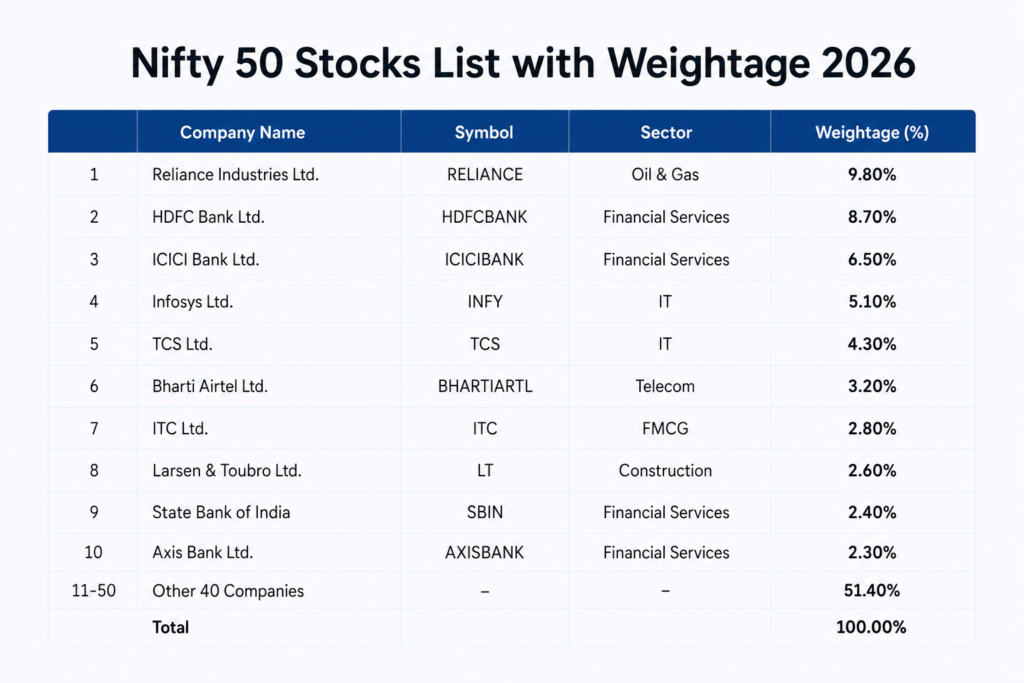
The table below provides the complete Nifty 50 stocks list with approximate weightage as of June 2026, reflecting the March 2026 semi-annual review outcome and current market capitalisation data. Note that weightages fluctuate daily with price changes; the figures below represent approximate values based on latest available data.
| # | Company Name | Sector | Approx. Weightage (%) |
|---|---|---|---|
| 1 | Reliance Industries Ltd. | Oil, Gas & Consumable Fuels | 9.52% |
| 2 | HDFC Bank Ltd. | Financial Services | 6.10% |
| 3 | Bharti Airtel Ltd. | Telecommunication | 5.88% |
| 4 | ICICI Bank Ltd. | Financial Services | 4.74% |
| 5 | State Bank of India | Financial Services | 4.69% |
| 6 | Tata Consultancy Services Ltd. | Information Technology | 4.43% |
| 7 | Infosys Ltd. | Information Technology | 4.30% |
| 8 | Larsen & Toubro Ltd. | Construction | 3.80% |
| 9 | ITC Ltd. | FMCG | 3.20% |
| 10 | Bajaj Finance Ltd. | Financial Services | 2.95% |
| 11 | Mahindra & Mahindra Ltd. | Automobiles & Auto Components | 2.80% |
| 12 | Axis Bank Ltd. | Financial Services | 2.70% |
| 13 | Kotak Mahindra Bank Ltd. | Financial Services | 2.50% |
| 14 | Tata Motors Ltd. | Automobiles & Auto Components | 2.30% |
| 15 | Sun Pharmaceutical Industries Ltd. | Healthcare | 2.10% |
| 16 | HCL Technologies Ltd. | Information Technology | 2.00% |
| 17 | Maruti Suzuki India Ltd. | Automobiles & Auto Components | 1.90% |
| 18 | NTPC Ltd. | Power | 1.80% |
| 19 | Hindustan Unilever Ltd. | FMCG | 1.75% |
| 20 | InterGlobe Aviation Ltd. (IndiGo) | Services (Aviation) | 1.70% |
| 21 | Power Grid Corporation of India | Power | 1.60% |
| 22 | Tata Steel Ltd. | Metals & Mining | 1.50% |
| 23 | UltraTech Cement Ltd. | Construction Materials | 1.45% |
| 24 | Wipro Ltd. | Information Technology | 1.40% |
| 25 | Bajaj Auto Ltd. | Automobiles & Auto Components | 1.35% |
| 26 | Asian Paints Ltd. | Consumer Durables | 1.30% |
| 27 | Titan Company Ltd. | Consumer Durables | 1.25% |
| 28 | Coal India Ltd. | Oil, Gas & Consumable Fuels | 1.20% |
| 29 | Adani Ports & SEZ Ltd. | Services | 1.15% |
| 30 | Oil & Natural Gas Corporation (ONGC) | Oil, Gas & Consumable Fuels | 1.10% |
| 31 | Hindalco Industries Ltd. | Metals & Mining | 1.05% |
| 32 | Tech Mahindra Ltd. | Information Technology | 1.00% |
| 33 | Grasim Industries Ltd. | Construction Materials | 0.95% |
| 34 | JSW Steel Ltd. | Metals & Mining | 0.92% |
| 35 | Bajaj Finserv Ltd. | Financial Services | 0.88% |
| 36 | Nestle India Ltd. | FMCG | 0.85% |
| 37 | Adani Enterprises Ltd. | Metals & Mining / Diversified | 0.82% |
| 38 | Shriram Finance Ltd. | Financial Services | 0.80% |
| 39 | Cipla Ltd. | Healthcare | 0.78% |
| 40 | Dr. Reddy’s Laboratories Ltd. | Healthcare | 0.76% |
| 41 | Tata Consumer Products Ltd. | FMCG | 0.74% |
| 42 | Wipro Ltd. | Information Technology | 0.72% |
| 43 | SBI Life Insurance Company Ltd. | Financial Services | 0.70% |
| 44 | LTIMindtree Ltd. | Information Technology | 0.68% |
| 45 | Eicher Motors Ltd. | Automobiles & Auto Components | 0.65% |
| 46 | Apollo Hospitals Enterprise Ltd. | Healthcare | 0.62% |
| 47 | HDFC Life Insurance Company Ltd. | Financial Services | 0.60% |
| 48 | Britannia Industries Ltd. | FMCG | 0.58% |
| 49 | Bharat Petroleum Corporation (BPCL) | Oil, Gas & Consumable Fuels | 0.55% |
| 50 | Max Healthcare Institute Ltd. | Healthcare | 0.49% |
* Weightage figures are approximate based on June 2026 market capitalisation data from publicly available NSE disclosures. Actual weightage fluctuates daily. Always verify with NSE Indices Limited or your broker for real-time data.
Top 10 Nifty 50 Stocks by Weightage — A Closer Look
The top 10 constituents by weight collectively account for roughly 50–52% of the entire index. This means that just ten companies essentially determine whether the Nifty moves up or down on most trading days. Here is a brief profile of each:
1. Reliance Industries Ltd. (~9.52%)
The undisputed heavyweight of the Nifty 50. Mukesh Ambani’s conglomerate spans oil refining, retail, and telecom (Jio). Its sheer size — one of the largest companies in Asia by market capitalisation — makes it the single biggest driver of index-level moves. A 2% swing in Reliance is enough to move the Nifty by roughly 20 points on its own.
2. HDFC Bank Ltd. (~6.10%)
India’s largest private sector bank by assets remains the bedrock of the Nifty’s financial services exposure. Post its merger with HDFC Ltd., the bank’s balance sheet has expanded dramatically, though its share price has modestly underperformed peers over 2024–25 as the market digested the merger’s impact on return ratios.
3. Bharti Airtel Ltd. (~5.88%)
One of the most significant weight changes in recent memory. Airtel’s rise to the third position reflects the massive re-rating the stock has received on the back of ARPU (average revenue per user) expansion, 5G rollout momentum, and its growing African business. It has moved up sharply from its earlier ~3.6% weight.
4. ICICI Bank Ltd. (~4.74%)
The fastest-growing of India’s large private banks by most efficiency metrics. ICICI’s consistent improvement in net interest margins, return on assets, and digital banking adoption has made it a favourite among both domestic mutual funds and FIIs.
5. State Bank of India (~4.69%)
India’s largest bank by deposits and branches, SBI’s weight in the index has grown steadily as its profitability has improved dramatically over the past five years. Stronger asset quality, lower NPAs, and improved capital adequacy have all contributed to its re-rating.
6 & 7. TCS and Infosys (~4.43% and ~4.30%)
India’s IT bellwethers have seen modest compression in their index weights over 2024–25 as global IT spending remained cautious and rupee appreciation pressured dollar-denominated earnings. However, both companies continue to generate enormous free cash flows and maintain industry-leading margins.
8. Larsen & Toubro Ltd. (~3.80%)
L&T is India’s premier engineering and construction conglomerate. Its weight has held up well as domestic capital expenditure — both government infrastructure spending and private sector capacity expansion — has surged in the current economic cycle.
9 & 10. ITC and Bajaj Finance (~3.20% and ~2.95%)
ITC, the diversified FMCG-to-hotels conglomerate, has seen significant value unlocking. Bajaj Finance, on the other hand, is the proxy for India’s consumer lending boom, though it faced some turbulence in late 2024 on concerns about asset quality in the unsecured lending segment.
Sector-Wise Nifty 50 Weightage Breakdown (2026)
Understanding sector weightage is arguably more useful than memorising individual stock weights. Sectors move together in response to macro themes — RBI rate decisions, global commodity prices, government budgets, and monsoon forecasts all tend to lift or depress entire sectors rather than single stocks.
Financial Services
HDFC Bank, ICICI, SBI, Axis, Kotak, Bajaj Finance + insurers
Information Technology
TCS, Infosys, HCL Tech, Wipro, Tech Mahindra, LTIMindtree
Oil, Gas & Energy
Reliance, ONGC, Coal India, BPCL, NTPC, Power Grid
Automobiles
M&M, Tata Motors, Maruti, Bajaj Auto, Eicher Motors
FMCG & Consumer
ITC, HUL, Nestle, Tata Consumer, Britannia, Titan, Asian Paints
Healthcare
Sun Pharma, Cipla, Dr. Reddy’s, Apollo Hospitals, Max Healthcare
The remaining weight is distributed across Telecom (Airtel alone at ~5.88%), Metals & Mining, Construction Materials (L&T, UltraTech, Grasim), and Services (Adani Ports, IndiGo).
Why Certain Sectors Dominate — Fundamental Analysis
Numbers are just the surface. To truly understand why the Nifty 50’s sector composition looks the way it does in 2026, you need to look at the fundamental drivers behind each dominant sector. This is where the index transforms from a list of stocks into a mirror of India’s economic evolution.
Why Financial Services Holds a Third of the Index
India is fundamentally an under-penetrated financial market. Credit-to-GDP ratio still sits below 60%, compared to 120–150% in developed economies. Insurance penetration is around 4% of GDP versus a global average of 7%. Mutual fund AUM as a percentage of GDP is growing but still far below mature markets. This structural under-penetration means India’s financial sector has decades of compounding growth ahead of it — and the market has priced that optimism into the valuations of banks, NBFCs, and insurers. When the broad economy grows, financial services grow faster. That is why HDFC Bank, ICICI, SBI, and Bajaj Finance have all delivered exceptional wealth creation over the past two decades — and why they remain the index’s largest occupants by far.
The entry of insurers like SBI Life and HDFC Life into the Nifty 50 reflects another dimension: the formalization of savings in India. As more households shift from physical gold and real estate to financial instruments, insurance and asset management companies are the structural beneficiaries.
Why IT Holds Its Ground Despite Global Headwinds
India’s IT sector — TCS, Infosys, HCL Tech, Wipro — generates a disproportionate share of its revenues from the United States and Europe. In a period when global tech spending has been cautious (CIOs tightening budgets post-2022 rate hikes), one would expect IT stocks to suffer. And to some degree, they did. Yet the sector maintains over 13% of the Nifty’s weight for a reason: Indian IT companies have extraordinarily high return on equity, generate massive free cash flows, hold net cash on their balance sheets, and are now pivoting meaningfully towards AI services and cloud transformation projects. The medium-term opportunity from enterprise AI adoption is enormous, and Indian IT firms are well-positioned to capture it.
Why Energy Is Re-Rating
Reliance Industries alone contributes ~9.52% to the Nifty. Add ONGC, Coal India, BPCL, and the power utilities (NTPC, Power Grid), and energy-related businesses account for over 12% of the index. India’s energy transition is dual-tracked — on one side, legacy oil and gas companies are generating record cash flows; on the other, the power sector is seeing massive capital investment in renewables, transmission infrastructure, and smart grids. Reliance’s bet on green energy through its Dhirubhai Ambani Green Energy Giga Complex has kept market excitement elevated around the stock even as traditional refining margins normalise. PSU energy companies, meanwhile, have benefited from government support for dividends and capex.
The Automobile Sector’s EV Transformation
The automobiles sector (~8.4% weight) is one of the more interesting stories in the 2025–2026 Nifty composition. Mahindra & Mahindra has surged — its weightage has risen significantly on the back of its SUV dominance and growing EV portfolio. Tata Motors, with Jaguar Land Rover (JLR) contributing strongly to consolidated profits, has also seen meaningful appreciation. The EV transition in India has begun, and while it is far from complete, the market is pricing in the change. The exit of Hero MotoCorp in the September 2025 rebalancing — and its replacement with IndiGo — reflects a broader shift in where India’s corporate capex story is playing out: from two-wheelers to aviation and hospitals.
Healthcare Entering the Spotlight
The addition of Max Healthcare in the September 2025 rebalancing is a significant signal. Healthcare has been one of the most under-represented sectors in Indian benchmarks relative to its actual economic significance. India is both a major pharmaceutical exporter and a rapidly growing domestic healthcare consumer. Sun Pharma, Cipla, and Dr. Reddy’s anchor the pharmaceutical exposure, while Apollo Hospitals and Max Healthcare represent the hospital and diagnostics side. As India’s middle class grows and health insurance penetration improves, the domestic hospital business should deliver consistent earnings growth — making this sector’s rising weight in the Nifty a secular rather than cyclical trend.
2025–2026 Rebalancing — What Actually Changed?
The Nifty 50 is not static. NSE Indices Limited reviews its composition twice a year, and understanding these changes can give you early signals about which sectors are gaining and losing corporate India’s confidence.
Added: InterGlobe Aviation (IndiGo) & Max Healthcare Institute Ltd.
Removed: Hero MotoCorp Ltd. & IndusInd Bank Ltd.
March 2026 Review: No constituent changes. Weightages adjusted per prevailing market capitalisations.
The removal of Hero MotoCorp is symbolically important. India’s largest two-wheeler company by volume is being challenged by the electric mobility shift — Bajaj, TVS, and Ola Electric are all gaining ground. Hero’s market cap has stagnated while the broader auto sector has re-rated. That gap created an opening for IndiGo.
The removal of IndusInd Bank was more dramatic. Concerns around its derivative accounting practices and management changes in late 2024 had severely impacted its stock price and market capitalisation. The bank had been a staple of the Nifty for years, but the market cap erosion made its exit mathematically inevitable.
The inclusion of IndiGo reflects India’s aviation boom. With passenger traffic at all-time highs, a duopolistic market structure (IndiGo and Air India), and strong balance sheet improvements post-COVID, IndiGo’s market cap finally cleared the threshold. Similarly, Max Healthcare‘s inclusion marks the formal arrival of India’s hospital sector in the Nifty 50 fold.
How to Invest in the Nifty 50 in 2026
You do not have to pick stocks individually to benefit from the Nifty 50’s performance. There are three primary routes:
1. Index Mutual Funds
Index funds tracking the Nifty 50 are among the lowest-cost investment products available in India. The expense ratio on direct plans from major AMCs (HDFC, ICICI Prudential, Nippon, UTI, Mirae Asset) typically ranges from 0.10% to 0.20% per annum. You can start with as little as ₹500 per month via SIP. The fund automatically replicates the index’s composition and rebalances itself whenever NSE makes changes.
2. Exchange Traded Funds (ETFs)
Nifty 50 ETFs trade live on the NSE during market hours, just like shares. They offer slightly lower expense ratios than index funds in some cases (as low as 0.05%), but require a demat account and an understanding of how to place market or limit orders. Popular options include Nippon India ETF Nifty 50 BeES, HDFC Nifty 50 ETF, and SBI Nifty 50 ETF.
3. Direct Stock Basket (Nifty 50 Basket)
Several modern brokerage platforms — Zerodha, Angel One, Groww — now offer a “Nifty 50 Basket” feature that allows you to invest in all 50 constituents in their exact index proportion with a single click. This gives you true index replication with full transparency into what you own. It requires more capital upfront (roughly ₹1.5–2 lakh for a complete one-share basket), but is increasingly popular among investors who want index-like exposure without any tracking error.
4. Futures and Options (Advanced)
For traders, Nifty 50 futures and options on the NSE are among the most liquid derivative instruments in the world by traded value. However, leverage cuts both ways — this is only appropriate for experienced traders with a clear understanding of risk management.
Frequently Asked Questions
Q1. How often is the Nifty 50 rebalanced?
The Nifty 50 is reviewed semi-annually by NSE Indices Limited. The cut-off dates are January 31 and July 31 of each year. Changes are typically announced six weeks after the cut-off date and become effective at the end of March and September respectively.
Q2. Which sector has the highest weightage in Nifty 50 in 2026?
Financial Services continues to hold the largest share at approximately 33–34%, led by HDFC Bank, ICICI Bank, SBI, Axis Bank, and Bajaj Finance among others.
Q3. Can one stock’s weightage exceed 10% in Nifty 50?
NSE Indices Limited has a cap mechanism where no single stock can exceed 10% of the index at the time of rebalancing. Reliance Industries, currently at ~9.52%, is the closest to this cap.
Q4. Is Adani group’s combined weight significant in the Nifty?
Adani Enterprises and Adani Ports together account for roughly 1.97% of the Nifty 50. Other Adani group entities (Adani Green, Adani Power) are not currently part of the Nifty 50 but appear in Nifty Next 50 and other broader indices.
Q5. What is the difference between Nifty 50 and Sensex?
The Nifty 50 is maintained by NSE Indices and comprises 50 stocks. The Sensex is the benchmark of the Bombay Stock Exchange (BSE) and tracks 30 stocks. Both cover India’s largest companies, and there is significant overlap in constituents, but they are managed by separate exchange entities and have slightly different constituent selections and calculation methodologies.
Q6. Does a higher weightage mean it is a better stock to buy?
Not necessarily. High weightage simply reflects high free-float market capitalisation relative to peers. Valuation, growth prospects, return ratios, and management quality are separate considerations entirely. A heavily weighted stock can be overvalued, and a low-weight stock can be deeply undervalued.
Q7. Where can I find real-time Nifty 50 weightage data?
The most authoritative source is the NSE India website (nseindia.com) under the Indices section. NSE Indices Limited publishes fact sheets monthly with exact weightages. You can also find live data on platforms like Moneycontrol, NSE Indices, and smart-investing.in.
Nothing in this article constitutes investment advice, a solicitation to buy or sell securities, or a financial recommendation. Investing in equities, index funds, ETFs, or derivatives involves market risk, including the possible loss of principal. Past performance of the Nifty 50 or any of its constituents does not guarantee future returns. Readers are strongly advised to consult a SEBI-registered investment advisor before making any investment decisions. The author and DesireTheWealth.com are not liable for any financial loss arising from actions taken based on this content.
All trademarks, index names, and company names mentioned are the property of their respective owners.