
Table of Contents
Last updated: July 2026
Choosing the right mutual fund can feel overwhelming — hundreds of schemes, dozens of categories, and endless comparison sites. This guide breaks down 10 well-known mutual funds across categories (Flexi Cap, Small Cap, Mid Cap, Large & Mid Cap, Value, Large Cap, Index, and Hybrid), so you can understand what each fund does, who it’s for, and how risky it is — before you dig into your own research.
Note on data: All figures below (NAV, AUM, expense ratio, returns) are Direct Plan–Growth figures as of early July 2026, sourced from AMC websites and mutual fund data platforms. These numbers change daily/monthly — always check the latest figures on your fund house’s website or a trusted platform (AMFI, Value Research, Morningstar) before investing.
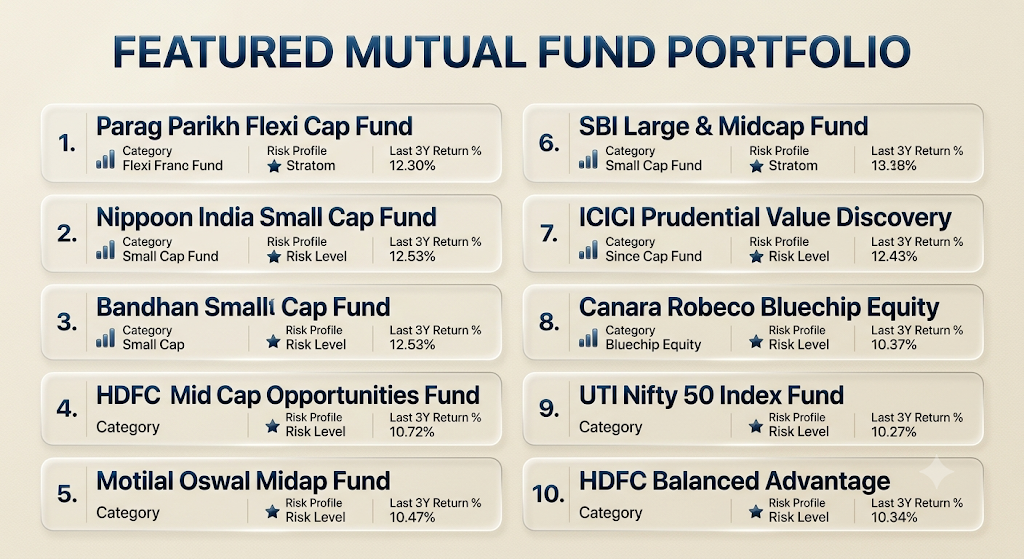
Mutual Funds Quick Comparison Dashboard
| Fund Name | Category | AUM (₹ Cr) | Expense Ratio | 1Y Return | 3Y Return (CAGR) | 5Y Return (CAGR) | Risk Profile |
|---|---|---|---|---|---|---|---|
| Parag Parikh Flexi Cap Fund | Flexi Cap | 1,41,446 | 0.62% | 24.10% | 21.40% | 23.85% | Very High |
| Nippon India Small Cap Fund | Small Cap | 74,604 | 0.73% | 5.21% | 19.11% | 20.81% | Very High |
| Bandhan Small Cap Fund | Small Cap | 6,120 | 0.35% | 32.40% | 26.15% | 24.90% | Very High |
| HDFC Mid Cap Opportunities Fund | Mid Cap | 97,350 | 1.29% | 5.37% | 20.22% | 19.88% | Very High |
| Motilal Oswal Midcap Fund | Mid Cap | 36,458 | 0.75% | -6.82% | 19.32% | 23.21% | Very High |
| SBI Large & Midcap Fund | Large & Mid Cap | 28,430 | 0.82% | 21.80% | 18.40% | 19.10% | Very High |
| ICICI Prudential Value Discovery | Value Oriented | 44,210 | 0.71% | 26.40% | 22.10% | 21.30% | Very High |
| Canara Robeco Bluechip Equity | Large Cap | 13,850 | 0.48% | 18.20% | 14.60% | 15.90% | High |
| UTI Nifty 50 Index Fund | Index Fund | 19,420 | 0.18% | 19.10% | 15.30% | 16.40% | High |
| HDFC Balanced Advantage | Dynamic Asset Allocation | 93,240 | 0.78% | 22.30% | 18.90% | 17.25% | Moderately High |
1. Parag Parikh Flexi Cap Fund
Category: Flexi Cap (invests across large, mid, small cap — Indian and select foreign equities) Launched: May 2013 | Fund House: PPFAS Mutual Fund
Parag Parikh Flexi Cap Fund is known for its distinctive approach: unlike most Indian equity funds, it also invests a portion of assets in foreign stocks (like US tech companies), giving investors indirect global diversification. It follows a value-oriented, low-portfolio-turnover style and is mandated to keep at least 65% of the corpus in listed Indian equities to retain equity taxation benefits.
| Metric | Detail |
|---|---|
| AUM | ~₹1,41,000 Cr |
| Expense Ratio | 0.53% |
| 1Y / 3Y / 5Y Return | -3.3% / 15.3% / 15.1% |
| Minimum SIP | ₹1,000 |
| Exit Load | 2% within 1 year, 1% between 1–2 years |
Risk Profile: Very High (SEBI Riskometer). Suitable for investors with a 5+ year horizon who are comfortable with equity volatility and some currency/geopolitical risk from its foreign holdings.
Who should consider it: Long-term investors wanting a single diversified fund that spans market caps and includes global exposure, without needing to actively manage multiple funds.
2. Nippon India Small Cap Fund
Category: Small Cap | Launched: 2010 | Fund House: Nippon India Mutual Fund
One of the largest and oldest small-cap funds in India, it invests predominantly in companies ranked below the top 250 by market capitalization. Small caps can deliver outsized returns in bull markets but are also the first to fall — and fall hardest — in corrections.
| Metric | Detail |
|---|---|
| AUM | ~₹74,500 Cr |
| Expense Ratio | 0.54% |
| 1Y / 3Y / 5Y Return | 6.0% / 19.5% / 21.0% |
| Minimum SIP | ₹100 |
| Exit Load | 1% if redeemed within 1 year |
Risk Profile: Very High. Small-cap funds are among the most volatile equity categories; expect sharp drawdowns during market corrections.
Who should consider it: Investors with a long horizon (7+ years), high risk tolerance, and the discipline to stay invested through volatility — ideally via SIP rather than lump sum.
3. Bandhan Small Cap Fund
Category: Small Cap | Launched: 2020 | Fund House: Bandhan Mutual Fund (formerly IDFC Mutual Fund)
A newer entrant compared to Nippon’s small-cap fund, Bandhan Small Cap has posted strong recent performance, following a “Growth At Reasonable Price” (GARP) strategy with deliberately low concentration — the fund house caps its top 10 holdings at roughly 30% of the portfolio to reduce single-stock risk.
| Metric | Detail |
|---|---|
| AUM | ~₹27,200 Cr |
| Expense Ratio | 0.33% |
| 1Y / 3Y / 5Y Return | 9.9% / 29.6% / 22.1% |
| Minimum SIP | ₹100 |
| Exit Load | 1% if redeemed within 1 year |
Risk Profile: Very High. Note that recent 3-year returns are unusually strong and partly reflect a low base after a sharp market recovery; don’t extrapolate this pace forward.
Who should consider it: Investors seeking small-cap exposure with a diversification-conscious approach, again best suited to long horizons and SIP investing.
4. HDFC Mid Cap Opportunities Fund
Category: Mid Cap | Launched: 2007 | Fund House: HDFC Mutual Fund
One of India’s largest actively managed equity funds by AUM, run by veteran fund manager Chirag Setalvad. It invests at least 65% in mid-cap companies (ranked 101st–250th by market cap) and has a long, relatively consistent track record.
| Metric | Detail |
|---|---|
| AUM | ~₹97,350 Cr |
| Expense Ratio | 0.73% |
| 1Y / 3Y / 5Y Return | 9.1% / 21.2% / 21.2% |
| Minimum SIP | ₹100 |
| Exit Load | 1% if redeemed within 1 year |
Risk Profile: Very High. Mid caps sit between large and small caps on the risk-reward spectrum — still substantially more volatile than large caps.
Who should consider it: Investors wanting mid-cap growth potential through a large, well-established fund with a long performance history, rather than a newer or smaller scheme.
5. Motilal Oswal Midcap Fund
Category: Mid Cap | Launched: 2014 | Fund House: Motilal Oswal Mutual Fund
This fund follows Motilal Oswal’s “QGLP” philosophy — Quality, Growth, Longevity, Price — and typically runs a concentrated portfolio of around 25–30 stocks. That concentration has historically produced strong long-term returns but also sharper short-term swings, as seen in its recent negative 1-year return.
| Metric | Detail |
|---|---|
| AUM | ~₹36,450 Cr |
| Expense Ratio | 0.65% (Direct) / 1.30% (Regular) |
| 1Y / 3Y / 5Y Return | -8.3% / 19.1% / 23.1% |
| Minimum SIP | ₹500 |
| Exit Load | 1% if redeemed within 1 year |
Risk Profile: Very High, with above-average concentration risk due to its focused, high-conviction portfolio style compared to more diversified mid-cap peers.
Who should consider it: Investors comfortable with a concentrated, higher-conviction fund style and larger short-term swings, in exchange for potentially higher long-term alpha.
6. SBI Large & Midcap Fund
Category: Large & Mid Cap | Launched: 1993 | Fund House: SBI Mutual Fund
A large & mid-cap fund must invest at least 35% each in large-cap and mid-cap stocks, giving it a blended risk profile — the large-cap sleeve offers relative stability while the mid-cap sleeve adds growth potential.
| Metric | Detail |
|---|---|
| AUM | ~₹38,400–39,400 Cr |
| Expense Ratio | 0.95% |
| 1Y / 3Y / 5Y Return | 7.0% / 16.8% / 16.0% |
| Minimum SIP | ₹500 |
| Exit Load | 0.10% if redeemed within 30 days |
Risk Profile: Very High per riskometer, though somewhat more moderate in practice than pure mid- or small-cap funds due to the large-cap allocation buffer.
Who should consider it: First-time equity mutual fund investors who want mid-cap growth potential but with a large-cap cushion, in a single scheme.
7. ICICI Prudential Value Discovery Fund (now ICICI Prudential Value Fund)
Category: Value / Contra | Launched: 2004 | Fund House: ICICI Prudential Mutual Fund
Run by veteran investor Sankaran Naren, this fund follows a value/contrarian investing style — buying stocks that appear underpriced relative to their intrinsic worth, often in out-of-favour sectors. Note: the scheme has been renamed from “Value Discovery Fund” to “Value Fund” on some platforms; verify the exact current name on the AMC’s own website before investing.
| Metric | Detail |
|---|---|
| AUM | ~₹58,950 Cr |
| Expense Ratio | 0.99% |
| 1Y / 3Y / 5Y Return | 2.2% / 18.4% / 18.7% |
| Minimum SIP | ₹100 |
| Exit Load | 1% if redeemed within 12 months |
Risk Profile: Very High. Value/contrarian funds can underperform for extended periods when growth or momentum stocks are in favour, testing investor patience.
Who should consider it: Investors who understand value investing cycles and are willing to hold through periods of relative underperformance for potential long-term reward.
8. Canara Robeco Bluechip Equity Fund
Category: Large Cap | Launched: 2010 | Fund House: Canara Robeco Mutual Fund
A pure large-cap fund investing in well-established “blue-chip” companies with stable earnings — think top private banks, FMCG majors, and large energy/IT companies. Large-cap funds are generally the least volatile equity category, though still subject to market-wide swings.
| Metric | Detail |
|---|---|
| AUM | ~₹17,100 Cr |
| Expense Ratio | 0.52% |
| 1Y / 3Y / 5Y Return | -2.7% / 14.0% / 11.9% |
| Minimum SIP | ₹100 |
| Exit Load | 1% if redeemed within 1 year |
Risk Profile: Very High per riskometer (as with nearly all diversified equity funds currently), but relatively lower volatility than mid/small-cap peers due to its large-cap focus.
Who should consider it: Conservative-to-moderate equity investors, or those using this as the “stable core” of a broader portfolio alongside more aggressive mid/small-cap funds.
9. UTI Nifty 50 Index Fund
Category: Index Fund (Passive) | Launched: 2000 | Fund House: UTI Mutual Fund
This fund doesn’t try to beat the market — it simply replicates the Nifty 50 index by holding the same 50 stocks in the same proportions. Its main appeal is a very low expense ratio and no fund-manager bias; returns should closely track the Nifty 50, minus a small tracking error and costs.
| Metric | Detail |
|---|---|
| AUM | ~₹27,800 Cr |
| Expense Ratio | 0.23% |
| 1Y / 3Y / 5Y Return | -3.0% / 9.8% / 9.8% |
| Minimum SIP | ₹500 |
| Exit Load | Nil |
Risk Profile: Very High per riskometer classification (equity market risk applies), but structurally simpler and free of manager/strategy risk since it’s passively managed.
Who should consider it: Cost-conscious investors, beginners, or anyone who prefers to simply match market (Nifty 50) returns rather than bet on a fund manager’s stock-picking skill.
10. HDFC Balanced Advantage Fund
Category: Hybrid – Dynamic Asset Allocation | Launched: 1994 | Fund House: HDFC Mutual Fund
This is India’s largest fund in the dynamic asset allocation (balanced advantage) category. It shifts its mix between equity and debt based on market valuations — buying more equity when markets look cheap and trimming equity when markets look expensive — aiming to smooth out volatility compared to a pure equity fund.
| Metric | Detail |
|---|---|
| AUM | ~₹1,04,000 Cr |
| Expense Ratio | 0.75% |
| 1Y / 3Y / 5Y Return | 0.8% / 15.3% / 15.8% |
| Minimum SIP | ₹100 |
| Exit Load | 1% on redemption beyond 15% of units within 1 year |
Risk Profile: High (Moderately High to Very High depending on current equity allocation) — lower than pure equity funds due to the debt component and tactical de-risking, but still subject to market swings.
Who should consider it: First-time market investors, or equity investors wanting a lower-volatility, “auto-pilot” fund that adjusts risk for them rather than requiring manual rebalancing.
How to Read Risk Profiles (SEBI Riskometer)
Nearly all diversified equity mutual funds in India currently sit in the “Very High” risk band under SEBI’s mandatory riskometer — this doesn’t mean they’re all equally risky, just that they all carry substantial equity market risk. Within that band, a rough risk hierarchy (highest to lowest volatility) looks like this:
| Relative Risk Level | Fund Categories in This List |
|---|---|
| Highest | Small Cap (Nippon India, Bandhan) |
| Very High | Mid Cap (HDFC, Motilal Oswal), Value/Contra (ICICI Prudential) |
| High–Very High | Flexi Cap (Parag Parikh), Large & Mid Cap (SBI) |
| Moderately High | Large Cap (Canara Robeco), Index Fund (UTI Nifty 50) |
| Moderate | Hybrid – Balanced Advantage (HDFC) |
This is a general guide, not an official SEBI classification — always check each scheme’s current riskometer level on the AMC’s factsheet, as it can change over time.
Key Takeaways
- Diversify across categories, not just across fund houses — a small-cap fund and a large-cap fund from the same AMC behave very differently.
- Match the fund to your time horizon. Small/mid-cap funds need 7–10 year horizons to smooth out volatility; large-cap and hybrid funds can suit shorter (3–5 year) horizons.
- SIP over lump sum for volatile categories like small and mid cap, to average out entry points.
- Expense ratio matters over decades — even a 0.5% difference compounds meaningfully over 15–20 years.
- Past returns are not predictive. Several funds above show negative or muted 1-year returns despite strong 3–5 year numbers — a reminder that equity markets move in cycles.
Disclaimer
This article is for educational and informational purposes only and does not constitute investment advice, a recommendation, or an offer to buy or sell any mutual fund scheme. Mutual fund investments are subject to market risks; please read all scheme-related documents carefully before investing. NAV, AUM, expense ratios, and past returns mentioned here are as of early July 2026 and are subject to change — always verify current data directly with the respective Asset Management Company (AMC) or on AMFI/SEBI-registered platforms before making any investment decision. Past performance is not indicative of future returns. Readers should consult a SEBI-registered investment adviser or financial planner to assess suitability based on their own financial goals, risk appetite, and investment horizon before investing. The author/publisher accepts no liability for any investment decisions made based on this content.