FUNDAMENTAL ANALYSIS OF ANY STOCK TELLS YOU ABOUT THE HEALTH OF THE COMAPNY.
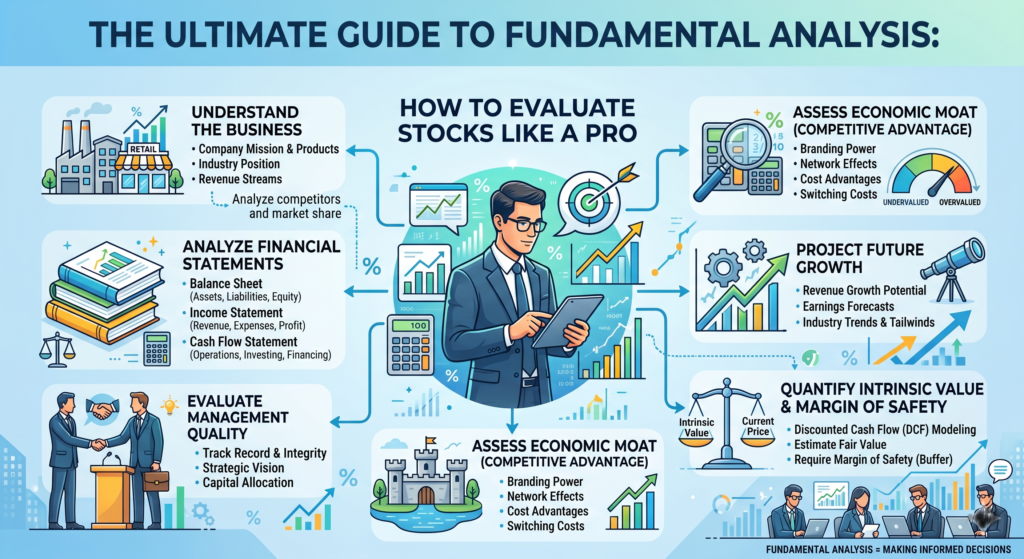
The Ultimate Guide to Fundamental Analysis: How to Evaluate Stocks Like a Pro
Imagine walking into a bustling marketplace. Two vendors are selling the exact same type of apple. One vendor shouts about the shiny, polished skin of their fruit, demanding a premium price because it “looks like a winner.” The other vendor invites you to slice the apple open, taste its sweetness, check its weight, and verify where it was grown, offering it at a fair discount.
In the stock market, the first vendor represents technical analysis (focusing on price movements and market psychology), while the second represents fundamental analysis.
Fundamental analysis is the art and science of measuring a company’s intrinsic value. By examining everything from the broader economy and industry conditions to the financial health and management quality of a specific company, fundamental analysis helps you determine whether a stock is a bargain, fairly priced, or dangerously overvalued.
This comprehensive guide will walk you through the core pillars of fundamental analysis, equipping you with the tools to dissect financial statements, evaluate qualitative factors, and make data-driven investment decisions.
Table of Contents
- What is Fundamental Analysis?
- The Two Approaches: Top-Down vs. Bottom-Up
- Qualitative Analysis: The Unquantifiable Moat
- Quantitative Analysis: Mastering Financial Statements
- Key Financial Ratios Every Investor Must Know
- Valuation Models: Finding Intrinsic Value
- Red Flags to Watch Out For
- Conclusion: Building Your Investment Checklist
1. What is Fundamental Analysis?
At its core, fundamental analysis operates on a simple premise: a stock token represents a fractional ownership in a real, living business. Over days or weeks, a stock’s price is driven by emotion, news headlines, and market noise. But over years, a stock’s price inevitably follows the trajectory of its business fundamentals—earnings, cash flow, and growth.
Intrinsic Value vs. Market Price
The ultimate goal of fundamental analysis is to calculate a company’s intrinsic value—what the business is actually worth based on its underlying assets and future earnings potential.
- If Intrinsic Value > Market Price: The stock is undervalued. It is trading at a discount, presenting a buying opportunity (a “margin of safety”).
- If Intrinsic Value < Market Price: The stock is overvalued. The market has priced in too much optimism, presenting a risk of capital loss.
2. The Two Approaches: Top-Down vs. Bottom-Up
Investors generally use one of two strategic pathways to conduct fundamental analysis. Both are valid, but they look at the economic landscape through opposite ends of the telescope.
The Top-Down Approach
The top-down approach starts with the big picture and narrows down to the individual stock.
- The Macroeconomy: How is global GDP growth? What are central banks doing with interest rates? Is inflation rising or falling?
- The Sector/Industry: Which industries stand to benefit from these macroeconomic conditions? (e.g., If interest rates are rising, banking sectors often thrive; if inflation is high, consumer defensive sectors like groceries hold up well).
- The Company: Out of the best-positioned industry, which specific company has the strongest fundamentals?
The Bottom-Up Approach
The bottom-up approach ignores macroeconomic forecasting and focuses entirely on the micro-level. Proponents of this method (like Warren Buffett) believe that an outstanding business with a stellar management team and strong competitive advantages will succeed regardless of temporary macroeconomic headwinds.
- Find a company with magnificent financial health and products.
- Analyze its direct competitors.
- Check the broader economic landscape only to ensure the company won’t be structurally destroyed by systemic collapse.
3. Qualitative Analysis: The Unquantifiable Moat
Before crunching a single number, you must understand what the company does and how it protects its profits. This is qualitative analysis. Think of it as assessing the character and muscle of the business.
The Economic Moat
Coined by Warren Buffett, an “economic moat” is a company’s ability to maintain a competitive advantage over its competitors to protect its long-term profits and market share. Just as a physical moat protects a castle, an economic moat protects a business from rival firms.
There are four primary types of economic moats:
- Network Effects: A product or service becomes more valuable as more people use it. (e.g., Visa, Meta/Facebook, Alphabet/Google).
- Cost Advantages: Companies that can produce goods or services at a lower cost than competitors can undercut them on price or reap higher margins. (e.g., Walmart, Costco).
- High Switching Costs: When it is too expensive, time-consuming, or operationally disruptive for a customer to switch to a competitor. (e.g., Enterprise software like Microsoft Office or Salesforce).
- Intangible Assets: Patents, regulatory licenses, or powerful brands that give a company a legal monopoly or pricing power. (e.g., Apple’s brand prestige, Pfizer’s medical patents).
Management and Corporate Governance
A beautiful ship will still crash if commanded by an incompetent captain. When analyzing management, ask yourself:
- Capital Allocation Track Record: How do they spend the company’s money? Do they reinvest wisely in R&D, make overpriced acquisitions, or return value to shareholders via dividends and share buybacks?
- Insider Ownership: Do the CEOs and executives own significant stock in the company? If their personal wealth is tied to the stock, their incentives align with yours.
- Transparency: Do they address mistakes candidly during quarterly earnings calls, or do they mask failures with overly complex corporate jargon?
4. Quantitative Analysis: Mastering the Financial Statements
Once you understand the narrative of the company, it’s time to verify if that narrative shows up in the hard data. Quantitative analysis requires diving into three core financial statements found in a company’s quarterly (10-Q) and annual (10-K) reports.
I. The Income Statement
The Income Statement tracks a company’s performance over a specific period (a quarter or a year). It shows revenues, expenses, and ultimately, the net profit.
Key components to look at:
- Revenue (Top Line): The total amount of money brought in by the sale of goods or services. Consistent year-over-year revenue growth indicates a healthy demand for the product.
- Gross Profit: Revenue minus the direct costs of producing goods (COGS). High gross margins indicate premium pricing power.
- Operating Income (EBIT): Profit earned from core business operations, excluding interest and taxes.
- Net Income (Bottom Line): The actual profit left over after all deductions. This is the figure used to calculate Earnings Per Share (EPS).
II. The Balance Sheet
The Balance Sheet is a snapshot of a company’s financial health at a specific moment in time. It operates on the fundamental accounting equation:
- Assets: What the company owns (Cash, inventory, property, equipment, patents).
- Liabilities: What the company owes (Short-term debt, long-term bonds, accounts payable).
- Shareholders’ Equity: The net worth of the company belonging to shareholders if all assets were liquidated and all debts paid off.
An investor should ideally look for a balance sheet with plenty of cash and manageable debt obligations.
III. The Cash Flow Statement
While the income statement can be adjusted using accounting techniques, the cash flow statement tells no lies. It tracks the actual physical cash entering and leaving the company’s bank accounts across three categories:
- Operating Cash Flow (OCF): Cash generated by core business activities. A healthy business must always have positive OCF.
- Investing Cash Flow: Cash spent on capital expenditures (CapEx) like buying machinery, building facilities, or acquiring other businesses.
- Financing Cash Flow: Cash moving between the company and its owners/creditors (issuing stock, paying dividends, buying back shares, borrowing debt).
The Holy Grail Metric: Free Cash Flow (FCF)
Free Cash Flow is the cash left over after a company pays for its operating expenses and capital expenditures. It represents the pure, unadulterated cash that management can use to reward shareholders, clear debt, or fuel future growth.
Free Cash Flow = Operating Cash Flow – Capital Expenditures
5. Key Financial Ratios Every Investor Must Know
Raw financial figures can be misleading without context. Financial ratios allow you to compare companies of different sizes within the same industry fairly.
| Ratio Category | Ratio Name | Formula | What It Tells You |
|---|---|---|---|
| Valuation | Price-to-Earnings (P/E) | Stock Price / Earnings Per Share |
How much the market is willing to pay for every dollar of profit. |
| Valuation | Price-to-Sales (P/S) | Market Cap / Total Revenue |
Useful for valuing early-stage or unprofitable tech companies. |
| Profitability | Return on Equity (ROE) | (Net Income / Shareholders' Equity) × 100 |
How efficiently management is using investors’ capital to generate profit. |
| Profitability | Profit Margin | (Net Income / Revenue) × 100 |
The percentage of revenue that turns into net income. |
| Liquidity & Debt | Debt-to-Equity | Total Liabilities / Shareholders' Equity |
The financial leverage of a company; higher means more debt risk. |
| Liquidity & Debt | Current Ratio | Current Assets / Current Liabilities |
Ability to pay off short-term obligations within one year. |
Deep Dive: Understanding the P/E Ratio
The P/E ratio is the most widely cited valuation metric, but it requires nuance.
- Trailing P/E: Uses the past 12 months of actual earnings.
- Forward P/E: Uses projected earnings for the next 12 months.
A high P/E ratio means investors expect rapid earnings growth in the future. However, if that growth fails to materialize, the stock price can collapse. Conversely, a low P/E ratio might mean a company is undervalued, or it could mean the company is a “value trap”—a structurally failing business whose profits are permanently shrinking.
6. Valuation Models: Finding Intrinsic Value
How do professionals convert all this quantitative data into a single target price? They use valuation models. Let’s look at the two most prominent methodologies.
The Discounted Cash Flow (DCF) Model
The DCF model is built on the time value of money concept: a dollar today is worth more than a dollar tomorrow. The model projects a company’s Free Cash Flows far into the future and discounts them back to the present day using a specific discount rate (typically reflecting inflation and the risk level of the investment).
The foundational formula for a multi-period DCF model looks like this:
Where:
- FCFt = Free Cash Flow in year t
- r = The discount rate (Weighted Average Cost of Capital)
- n = The final year of the projection period
- Terminal Value = The estimated value of the company beyond the projection period
Note: While highly accurate in theory, the DCF model is highly sensitive to its inputs. Small changes in projected growth rates or discount rates can vastly alter the calculated intrinsic value.
The Dividend Discount Model (DDM) / Gordon Growth Model
If a company pays a reliable, steadily growing dividend, you can value it based on the present value of those future dividend payouts.
Where:
- D1 = Expected dividend next year
- r = Required rate of return for the investor
- g = Constant growth rate of the dividend
7. Red Flags to Watch Out For
High-quality fundamental analysis isn’t just about finding what to buy; it’s equally about knowing what to avoid. Keep your eyes open for these warning signs when reviewing a company’s reports:
- Divergence Between Net Income and Operating Cash Flow: If a company reports rising net incomes year after year, but its operating cash flows are flat or negative, it is likely using aggressive accounting tricks to book revenues that haven’t actually materialized into cash.
- Skyrocketing Debt Loads: Debt can amplify returns during a booming economy, but it acts as a noose during recessions. If the Debt-to-Equity ratio climbs significantly higher than industry averages, the company risks insolvency.
- Frequent “One-Time” or Non-Recurring Charges: Companies love to strip out expenses and present an adjusted, “cleaner” version of earnings (Adjusted EBITDA). If a company has “one-time restructuring fees” every single quarter, those aren’t one-time occurrences—they are regular business costs hidden in plain sight.
- Consistent Share Dilution: If a company continuously issues new shares of stock to fund its operations or reward its executive team with massive stock options, it dilutes existing investors. You end up owning a smaller slice of the corporate pie.
8. Conclusion: Building Your Investment Checklist
Mastering fundamental analysis takes patience and practice. It requires stepping away from ticker screens and flashing green or red charts, and instead putting on the hat of a business owner.
To systematically evaluate any stock, develop an entry checklist based on the concepts covered in this guide:
- Understand the Business Model: Can you explain how this company makes money in two sentences or less to a child?
- Verify the Competitive Moat: What stops a competitor from copying this product tomorrow?
- Check Management Alignment: Are insiders buying or selling their own shares?
- Examine Financial Growth Trends: Is revenue and EPS increasing consistently over a 5 to 10-year horizon?
- Analyze Financial Health: Is the current ratio above 1.5? Is Free Cash Flow strong and positive?
- Calculate Valuation Relative to Peers: How do the P/E, P/S, and EV/EBITDA ratios compare to direct historical averages and competitors?
By adhering to this disciplined structure, you insulate yourself from herd mentality, navigate volatility with confidence, and build a high-conviction portfolio designed for long-term wealth compounding.