MUTUAL FUNDS DETAILED ANALYSIS ON EXPENSES

MUTUAL FUNDS
MUTUAL FUNDS

Mutual Funds Explained: Expense Ratio, Sharpe Ratio & Key Metrics Every Investor Must Know (2026 Guide)


What Are Mutual Funds?

A mutual fund is a professionally managed investment vehicle that pools money from multiple investors to purchase a diversified portfolio of stocks, bonds, or other securities. Each investor owns “units” or “shares” of the fund, and the fund’s performance is distributed proportionally.

In India alone, the mutual fund industry managed over ₹65 lakh crore in Assets Under Management (AUM) as of 2025, reflecting the explosive growth in retail participation. In the US, the industry manages over $25 trillion in assets.

Whether you are a first-time investor or a seasoned market participant, understanding the key metrics and ratios of mutual funds is not optional — it is essential for making informed financial decisions.


How Mutual Funds Work

When you invest in a mutual fund:

  1. Your money is pooled with thousands of other investors.
  2. A fund manager (or a team) actively or passively manages the portfolio.
  3. The fund invests in securities aligned with its stated objective (e.g., large-cap equities, government bonds, gold).
  4. Your returns are a reflection of the underlying portfolio’s performance, minus costs.

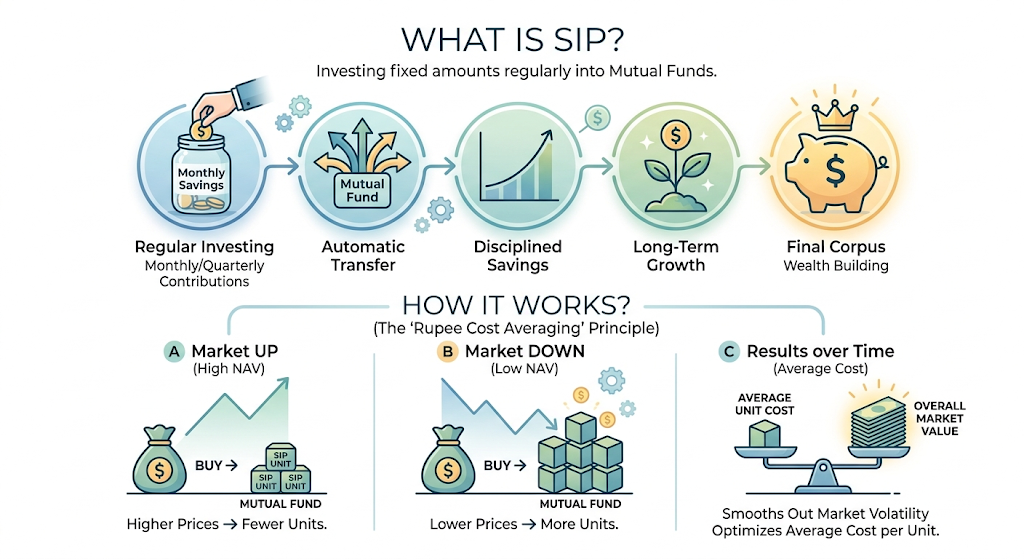
The beauty of mutual funds lies in diversification — even a small investment of ₹500 or $50 via a SIP (Systematic Investment Plan) gives you exposure to dozens or hundreds of securities.


Types of Mutual Funds

Before diving into metrics, here is a quick overview of the main categories:

  • Equity Mutual Funds — Invest primarily in stocks; higher risk, higher potential returns.
  • Debt Mutual Funds — Invest in fixed-income instruments like bonds; relatively lower risk.
  • Hybrid Mutual Funds — A mix of equity and debt to balance risk and return.
  • Index Funds — Passively track a market index such as Nifty 50 or S&P 500.
  • ELSS (Equity Linked Savings Scheme) — Tax-saving funds under Section 80C in India with a 3-year lock-in.
  • Liquid Funds — Invest in very short-term instruments; ideal for parking emergency funds.
  • International Funds — Invest in foreign markets for global diversification.
  • Sectoral/Thematic Funds — Concentrated exposure to specific industries like technology, pharma, or banking.

Each type comes with its own risk profile and ideal investor profile.


Expense Ratio: The Silent Return Killer

What Is the Expense Ratio?

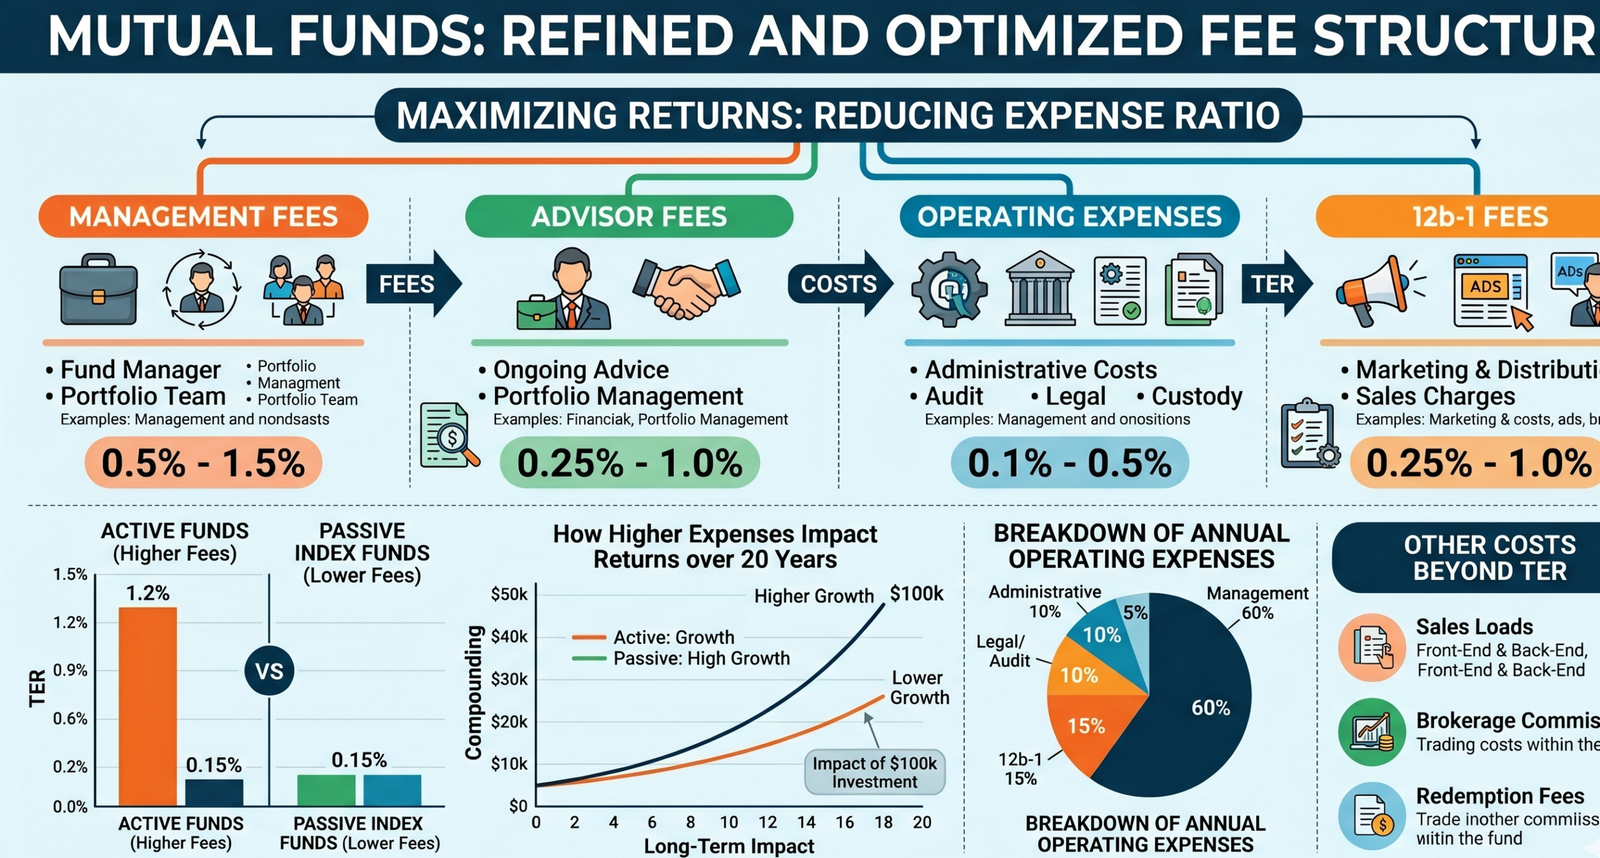
The expense ratio is the annual fee that a mutual fund charges its investors to cover operating costs, including fund management fees, administrative expenses, marketing costs, and regulatory fees. It is expressed as a percentage of the fund’s total assets.

Formula:

Expense Ratio = (Total Annual Fund Expenses ÷ Average AUM) × 100


Why Does the Expense Ratio Matter?

The expense ratio is deducted from the fund’s NAV on a daily basis — meaning you never see it as a direct charge, but it silently erodes your returns over time.

Example: Suppose two funds both generate a gross return of 12% per year.

  • Fund A has an expense ratio of 0.10% (index fund)
  • Fund B has an expense ratio of 1.50% (actively managed fund)

Over 20 years on a ₹1 lakh investment:

  • Fund A grows to approximately ₹8.62 lakh
  • Fund B grows to approximately ₹7.14 lakh

The difference? Over ₹1.48 lakh — lost entirely to fees!


What Is a Good Expense Ratio?

Fund TypeLow (Good)AverageHigh (Expensive)
Index/ETF0.05% – 0.20%0.20% – 0.50%Above 0.50%
Active Equity0.50% – 1.00%1.00% – 1.50%Above 2.00%
Debt Funds0.20% – 0.50%0.50% – 1.00%Above 1.50%

Pro Tip: SEBI in India has imposed TER (Total Expense Ratio) limits based on AUM slabs. Always opt for Direct Plans over Regular Plans — they have a 0.5%–1.5% lower expense ratio since there is no distributor commission.


Sharpe Ratio: Measuring Risk-Adjusted Returns

What Is the Sharpe Ratio?

Developed by Nobel laureate William F. Sharpe, the Sharpe ratio measures the return earned per unit of total risk taken. It helps investors understand whether a fund’s returns are the result of smart investing decisions or excessive risk-taking.

Formula:

Sharpe Ratio = (Fund Return − Risk-Free Rate) ÷ Standard Deviation of Fund Returns

  • Fund Return: The annualised return of the mutual fund.
  • Risk-Free Rate: Typically the return on a government bond or a fixed deposit (e.g., 6.5% in India).
  • Standard Deviation: The volatility of the fund’s returns.

How to Interpret the Sharpe Ratio

Sharpe RatioInterpretation
Below 1.0Poor — risk not adequately compensated
1.0 – 1.99Good — decent risk-adjusted performance
2.0 – 2.99Very Good — strong performance
3.0 and aboveExcellent — outstanding risk-adjusted returns

Example:

  • Fund X returns 14%, risk-free rate is 6.5%, standard deviation is 15%
  • Sharpe Ratio = (14 − 6.5) ÷ 15 = 0.50 (Not great)
  • Fund Y returns 14%, risk-free rate is 6.5%, standard deviation is 9%
  • Sharpe Ratio = (14 − 6.5) ÷ 9 = 0.83 (Better!)

Both funds delivered the same return — but Fund Y did so with significantly less volatility, making it the superior choice from a risk-adjusted perspective.


Alpha: Are Fund Managers Adding Value?

What Is Alpha?

Alpha represents the excess return of a mutual fund compared to its benchmark index after adjusting for risk. A positive alpha means the fund manager has generated returns above what the market would have delivered. A negative alpha means underperformance.

Formula:

Alpha = Fund Return − [Risk-Free Rate + Beta × (Benchmark Return − Risk-Free Rate)]

Interpreting Alpha

  • Positive Alpha (+2): The fund outperformed its benchmark by 2% on a risk-adjusted basis — excellent.
  • Zero Alpha: The fund matched its benchmark — similar to owning an index fund.
  • Negative Alpha (−1.5): The fund underperformed the benchmark by 1.5% — the manager destroyed value.

For actively managed funds, consistent positive alpha over 3–5 years is the primary justification for paying a higher expense ratio. If a fund consistently shows negative or near-zero alpha, switching to a low-cost index fund makes far more economic sense.


Beta: Understanding Market Sensitivity

What Is Beta?

Beta measures a mutual fund’s sensitivity to movements in its benchmark index. It indicates how much the fund’s value is likely to change when the market moves by a certain percentage.

Beta ValueMeaning
Beta = 1.0Fund moves in line with the market
Beta > 1.0Fund is more volatile than the market (aggressive)
Beta < 1.0Fund is less volatile than the market (defensive)
Beta < 0Fund moves inversely to the market (rare)

Example: A fund with a beta of 1.3 means that if the Nifty 50 rises by 10%, the fund is expected to rise by 13%. Conversely, if the index falls by 10%, the fund may fall by 13%.

Who Should Care About Beta?

  • Conservative investors and retirees should prefer low-beta funds.
  • Aggressive growth investors may prefer high-beta funds during bull markets.
  • Beta is especially useful when combined with the Treynor Ratio (explained later).

Standard Deviation: Gauging Volatility

What Is Standard Deviation in Mutual Funds?

Standard deviation measures the degree to which a fund’s returns deviate from its average (mean) return over a specific period. It is the most widely used measure of total risk in a portfolio.

A higher standard deviation means the fund’s returns are more unpredictable — swinging wildly from highs to lows. A lower standard deviation indicates steadier, more consistent returns.

Example:

  • Fund A: Average annual return of 12% with a standard deviation of 5% → returns typically range from 7% to 17%
  • Fund B: Average annual return of 12% with a standard deviation of 20% → returns typically range from −8% to 32%

Both funds have the same average return, but Fund A offers far more predictable outcomes for conservative investors.


Sortino Ratio: A Smarter Risk Metric

The Sortino Ratio is a refinement of the Sharpe Ratio. The key difference? While the Sharpe Ratio penalises both upside and downside volatility, the Sortino Ratio only penalises downside volatility — which is the risk most investors actually care about.

Formula:

Sortino Ratio = (Fund Return − Risk-Free Rate) ÷ Downside Deviation

A higher Sortino Ratio indicates better risk-adjusted performance, specifically relative to harmful downside risk. For equity funds that experience large temporary drawdowns, the Sortino Ratio is often a more meaningful metric than the Sharpe Ratio.


What Is NAV?

NAV (Net Asset Value) is the per-unit price of a mutual fund. It is calculated at the end of every trading day.

Formula:

NAV = (Total Assets − Total Liabilities) ÷ Total Units Outstanding

Common NAV Misconception

Many investors mistakenly believe that a fund with a lower NAV (say ₹10) is “cheaper” and thus a better buy than a fund with a higher NAV (say ₹500). This is completely incorrect.

NAV by itself tells you nothing about value. A fund with NAV of ₹500 may have been growing steadily for 15 years and represent excellent value, while a new fund at ₹10 NAV may never recover from poor performance. What matters is the growth trajectory and underlying portfolio quality, not the absolute NAV figure.


Portfolio Turnover Ratio

What Is Portfolio Turnover?

The portfolio turnover ratio measures how frequently a fund buys and sells its holdings within a year. It is expressed as a percentage.

  • High Turnover (above 100%): The fund manager frequently trades, incurring higher transaction costs and tax implications — which can reduce net returns.
  • Low Turnover (below 30%): A buy-and-hold approach that reduces costs and is tax-efficient.

Index funds typically have turnover ratios of less than 10%, while some active funds churn their portfolios at 150–200% annually. High turnover without corresponding outperformance is a red flag.


AUM (Assets Under Management)

AUM refers to the total market value of all investments managed by a mutual fund at a given point in time.

Why AUM Matters

  • Very small AUM (below ₹100 crore) can indicate a fund struggling to attract investors — which may affect liquidity.
  • Very large AUM in small-cap or mid-cap funds can be a problem — it becomes harder to take meaningful positions in smaller companies without moving the market.
  • For liquid and debt funds, larger AUM usually signals stability and better deal-making ability.

A fund’s AUM should always be evaluated in the context of its category, not in isolation.


Treynor Ratio

The Treynor Ratio (also called the reward-to-volatility ratio) is similar to the Sharpe Ratio but uses beta (systematic/market risk) instead of standard deviation (total risk) in the denominator.

Formula:

Treynor Ratio = (Fund Return − Risk-Free Rate) ÷ Beta

The Treynor Ratio is best used when comparing diversified funds that are part of a larger portfolio — since unsystematic (company-specific) risk has already been diversified away. A higher Treynor Ratio is better.


How to Compare Mutual Funds Using These Metrics

When evaluating and shortlisting mutual funds, follow this structured framework:

Step 1 — Define Your Goal Are you investing for wealth creation, regular income, tax saving, or capital preservation? This determines the right fund category.

Step 2 — Check Rolling Returns (3-Year, 5-Year, 10-Year) Don’t rely on point-to-point returns. Rolling returns show consistency across multiple market cycles.

Step 3 — Evaluate the Expense Ratio Always prefer the Direct Plan. Compare expense ratios within the same category. For passive funds, the expense ratio should be near 0.10%–0.20%.

Step 4 — Analyse the Sharpe Ratio Among similar funds with similar returns, pick the one with a higher Sharpe Ratio — it took less risk to deliver those returns.

Step 5 — Check Alpha Over Multiple Periods A fund with consistent positive alpha over 5+ years justifies active management costs.

Step 6 — Review Beta Based on Your Risk Appetite Aggressive investors can tolerate high-beta funds; conservative investors should look for beta below 0.8.

Step 7 — Assess Standard Deviation Especially important for goal-based investing. A fund with very high standard deviation is unsuitable for goals within 3 years.

Step 8 — Verify AUM and Fund House Track Record Check the fund house’s overall credibility, fund manager tenure, and whether AUM is appropriate for the fund’s strategy.


Common Mistakes Investors Make

1. Chasing Past Returns A fund that returned 45% last year is not guaranteed to repeat that performance. Evaluate consistency, not peak performance.

2. Ignoring the Expense Ratio Even a 0.5% difference in expense ratio can cost lakhs over a 20-year investment horizon.

3. Confusing Low NAV with Cheap Valuation NAV is just a price per unit, not a quality indicator.

4. Over-Diversification Holding 15–20 different mutual funds does not necessarily reduce risk — many funds in the same category hold overlapping stocks. Aim for 4–6 well-diversified funds.

5. Stopping SIPs During Market Crashes Market downturns are when SIPs work best — you accumulate more units at lower prices, averaging down your cost.

6. Ignoring Tax Implications Equity funds held under 1 year attract 20% Short-Term Capital Gains (STCG). Held over 1 year, gains above ₹1.25 lakh are taxed at 12.5% LTCG (post Budget 2024 rules in India).


FAQs About Mutual Fund Metrics

Q1. What is a good Sharpe Ratio for a mutual fund? Generally, a Sharpe Ratio above 1.0 is considered good. Above 2.0 is excellent. However, always compare Sharpe Ratios within the same fund category, not across different asset classes.

Q2. Is a higher expense ratio justified for actively managed funds? Only if the fund consistently delivers alpha above the additional cost. If a fund has a 1.5% expense ratio but only generates 0.5% alpha, the net benefit is negative.

Q3. Should I prefer low-beta or high-beta funds? It depends on your investment horizon and risk tolerance. For a 10+ year horizon, high-beta equity funds have historically rewarded patient investors well. For shorter horizons or if you are risk-averse, low-beta funds are more appropriate.

Q4. Does a fund’s NAV matter when choosing a mutual fund? No. NAV only tells you the current price per unit. What matters for comparison purposes is the fund’s returns, risk ratios, and portfolio quality — not its absolute NAV value.

Q5. What is the ideal expense ratio for an index fund? For index funds and ETFs, an expense ratio of 0.05% to 0.20% is considered very good. Anything above 0.50% for an index fund should prompt you to look for better alternatives.


Final Thoughts: Invest Smarter, Not Harder

Mutual funds are one of the most accessible, diversified, and professionally managed investment tools available to retail investors today. But simply putting money into a “top-rated” fund without understanding the underlying metrics is like buying a car based solely on its paint colour.

The metrics covered in this guide — expense ratio, Sharpe ratio, alpha, beta, standard deviation, Sortino ratio, NAV, portfolio turnover, AUM, and Treynor ratio — collectively paint a comprehensive picture of a fund’s cost, performance, and risk profile.

Here’s a quick recap of what to look for:

MetricWhat You Want
Expense RatioLower is better
Sharpe RatioHigher is better (above 1 is good)
AlphaPositive, consistent alpha
BetaMatches your risk appetite
Standard DeviationLower for conservative goals
Sortino RatioHigher is better
Portfolio TurnoverLower is generally better
AUMAppropriate for fund’s strategy
Treynor RatioHigher is better for diversified funds

Before making any investment, always read the Scheme Information Document (SID) and the Key Information Memorandum (KIM). Consider consulting a SEBI-registered financial advisor for personalised guidance.

Remember: The best mutual fund is not the one with the highest past return — it is the one best aligned with your financial goals, risk tolerance, investment horizon, and cost sensitivity.


Disclaimer: This article is for informational and educational purposes only. It does not constitute financial or investment advice. Please consult a qualified financial advisor before making investment decisions.


What is SIP(systematic investment plan) and How does it works?

what is SIP
what is SIP

The Magic of Consistency: Mastering the Art of the Systematic Investment Plan (SIP)

In the world of finance, there is a recurring myth that you need a massive windfall—a “mountain of gold”—to start building serious wealth. We often picture the stock market as a playground exclusively for the elite, filled with complex tickers and high-stakes gambles.

But what if the most powerful tool for wealth creation wasn’t a secret tip or a lucky break, but a simple, disciplined habit? Enter the Systematic Investment Plan (SIP). It is the financial equivalent of a marathon; it’s not about how fast you run the first mile, but the fact that you keep moving, step by step, until you reach the finish line.

What Exactly is an SIP?

At its core, a Systematic Investment Plan (SIP) is a method of investing a fixed sum of money into a mutual fund at regular intervals—usually monthly, quarterly, or even weekly. Instead of trying to “time the market” by waiting for prices to drop, you invest consistently regardless of market conditions.

Think of it like a subscription service for your future self. Just as you pay for Netflix or Spotify every month, an SIP automates your savings, moving money from your bank account into a chosen investment portfolio.

The Core Philosophy

The SIP philosophy is built on three pillars:

  1. Discipline: It forces you to save before you spend.
  2. Averaging: It turns market volatility into an advantage.
  3. Compounding: It harnesses the “eighth wonder of the world” by staying invested for the long haul.

How Does an SIP Actually Work?

To understand how an SIP functions, we need to look at the mechanics of Net Asset Value (NAV) and Rupee Cost Averaging.

1. The Allocation of Units

When you invest in a mutual fund, you are buying “units.” The price of one unit is called the NAV.

  • If the market is up, the NAV is high, and your fixed investment buys fewer units.
  • If the market is down, the NAV is low, and your fixed investment buys more units.

2. Rupee Cost Averaging

This is the “secret sauce” of SIPs. Because you are buying more units when prices are low and fewer when prices are high, your average cost per unit over time tends to be lower than the average market price. You essentially stop worrying about whether the market is at a “peak” or a “trough” because the system self-corrects.

3. The Power of Compounding

Compounding happens when the returns on your investment start earning their own returns. In an SIP, the longer you stay invested, the more dramatic the growth becomes.

The mathematical formula for the future value of an SIP is:

$$FV = P \times \frac{(1 + r)^n – 1}{r} \times (1 + r)$$

Where:

  • $FV$ = Future Value
  • $P$ = Monthly investment amount
  • $r$ = Monthly rate of interest (Annual rate / 12)
  • $n$ = Number of installments (Months)

Even a small monthly contribution can balloon into a significant corpus over 15 to 20 years because of this exponential growth curve.

Why Choose SIP over Lumpsum?

While a lumpsum investment (investing a large amount all at once) can be profitable if timed perfectly, it carries significant emotional and financial risk. Here is how they compare:

FeatureSIPLumpsum
Market TimingNot required; eliminates guesswork.Crucial; buying at a peak can hurt returns.
AffordabilityStart small (often as low as $500).Requires a large initial capital.
Risk ProfileMitigates volatility through averaging.Higher risk of immediate capital loss.
PsychologyPromotes disciplined, stress-free saving.Can lead to “investor’s remorse” during dips.

The Step-by-Step Guide to Starting Your SIP

Starting an SIP is simpler than it has ever been. With modern fintech apps and digital banking, you can set one up in under ten minutes.

Step 1: Define Your Financial Goals

Are you saving for a down payment on a house? Your child’s education? Or a comfortable retirement? Assigning a goal to your SIP helps you stay motivated when the market gets bumpy.

Step 2: Choose the Right Fund Type

Not all SIPs are created equal. You must match the fund to your risk appetite:

  • Equity Funds: High risk, high reward. Best for long-term goals (7+ years).
  • Debt Funds: Lower risk, steady returns. Good for short-to-medium-term goals.
  • Hybrid Funds: A mix of both, providing a balanced approach.

Step 3: Determine the Amount and Frequency

Be realistic. It is better to start a small SIP that you can maintain for ten years than a large one that you have to cancel after six months because of a cash crunch.

Step 4: Automate the Process

Set up an “Auto-debit” or “Bank Mandate.” By automating the transfer, you remove the “choice” of whether to invest or spend, ensuring your financial goals stay on track.

Common Myths vs. Reality

Despite their popularity, several misconceptions surround SIPs. Let’s clear the air:

Myth: SIPs are only for small investors.

Reality: While SIPs are accessible for small investors, many high-net-worth individuals use them to manage liquidity and reduce the risk of entering a volatile market with millions at once.

Myth: You cannot stop an SIP once started.

Reality: SIPs offer incredible flexibility. You can pause, stop, or increase (Top-up) your investment at any time without heavy penalties.

Myth: SIPs guarantee positive returns.

Reality: SIPs are a method of investing, not a guarantee. They are subject to market risks. However, historically, the probability of negative returns decreases significantly as the investment duration increases beyond 5–7 years.

Strategies for Success: “The Pro Moves”

If you want to take your SIP journey from “good” to “extraordinary,” consider these advanced strategies:

1. The Step-Up SIP

Increase your SIP amount annually in line with your salary hikes. Even a 10% annual increase in your SIP contribution can nearly double your final corpus over long periods.

2. Don’t Fear the Dip

When the market crashes, the natural instinct is to panic and stop the SIP. This is a mistake. A market dip is when your SIP works hardest, buying more units at “sale” prices. Continuing your SIP during a bear market is the single most effective way to build wealth.

3. Review, Don’t React

Check your portfolio once or twice a year to ensure the fund is performing well compared to its benchmark. Do not check it daily; the “noise” of daily market fluctuations will only lead to emotional decision-making.

The Psychological Edge: Peace of Mind

Beyond the numbers, the greatest benefit of an SIP is psychological freedom.

We live in an era of information overload. Every day, news headlines scream about inflation, geopolitical tensions, or interest rate hikes. Trying to navigate these as an individual investor is exhausting. An SIP acts as a shield. It allows you to ignore the noise, knowing that your wealth is growing quietly in the background while you focus on your career, your family, and your life.

Conclusion: The Best Time to Start was Yesterday

In finance, there is a famous saying: “The best time to plant a tree was 20 years ago. The second best time is now.”

The math of an SIP is undeniable—time is a much more powerful factor than the amount invested. By starting today, even with a modest sum, you are giving your money the time it needs to grow, compound, and eventually provide you with the financial freedom you deserve.

The journey to financial independence doesn’t require a miracle. It just requires a system. Start your SIP today, stay the course, and let time do the heavy lifting.


Disclaimer

The information provided in this article is for educational and informational purposes only and does not constitute financial, investment, or professional advice. Investing in Mutual Funds through a Systematic Investment Plan (SIP) involves market risks, including the possible loss of principal. Past performance is not a reliable indicator of future results. Before making any investment decisions, it is recommended that you:

  • Conduct your own research or consult with a certified financial advisor.
  • Assess your risk appetite and financial goals thoroughly.
  • Read all scheme-related documents carefully to understand the specific risks associated with any fund.

The author and publisher are not responsible for any financial losses or decisions made based on the content of this article.

HDFC Bank Crisis 2026: Why the Chairman Resigned and 3 Top Executives Were Fired

hdfc bank

HDFC Bank Governance Crisis 2026: AT1 Bond Scandal, Executive Terminations, and the Chairman’s Exit

The Indian banking sector was sent into a tailspin in March 2026 as HDFC Bank, the country’s largest private-sector lender, faced a dual-pronged crisis of leadership and ethics. Within a single week, the bank witnessed the abrupt resignation of its Part-time Chairman, the termination of three top-tier executives, and a staggering ₹1.34 lakh crore ($16 billion) erosion in market capitalization.

At the heart of this turmoil is a brewing scandal involving the alleged mis-selling of Additional Tier-1 (AT1) bonds to High-Net-Worth Individuals (HNIs) and Non-Resident Indians (NRIs). This article explores the intricate details of the AT1 controversy, the high-profile exits, and what this means for the future of India’s most valuable bank.


1. The AT1 Bond Controversy: Mis-selling and Global Fallout

The crisis traces its roots to the bank’s international operations in Dubai (DIFC) and Bahrain. Internal investigations revealed a systemic failure in the sale of complex financial instruments—specifically Credit Suisse AT1 bonds.

What are AT1 Bonds?

Additional Tier-1 (AT1) bonds are perpetual debt instruments used by banks to maintain regulatory capital. While they offer higher yields (often 10% to 13%), they carry a “loss-absorbency” clause. If the issuing bank faces a financial collapse, these bonds can be written down to zero before equity is touched.

The Nature of the Allegations

The controversy erupted when NRI clients alleged that HDFC Bank employees misrepresented these high-risk bonds:

  • Safety Misrepresentation: Bonds were allegedly pitched as “safe, fixed-maturity products,” comparable to traditional FCNR (Foreign Currency Non-Resident) deposits.
  • Aggressive Fund Diversion: Clients were reportedly persuaded to move secure deposits from India to overseas accounts in Bahrain to fund these bond purchases.
  • Lack of Disclosure: Critical risks—such as the fact that the bonds had no maturity date and could be wiped out—were allegedly omitted during the sales pitch.
  • The 2023 Trigger: When Credit Suisse collapsed in 2023, its AT1 bonds worth $17 billion were written down to zero. NRI investors who purchased these through HDFC Bank lost their entire principal.

2. Termination of Top Executives: A “Clean-up” Operation

On March 20-21, 2026, HDFC Bank took the unprecedented step of terminating three of its most senior leaders. This move followed a year-long internal probe and mounting pressure from the Dubai Financial Services Authority (DFSA).

Who was Removed?

The bank’s “accountability sweep” targeted the very top of its international and branch banking hierarchy:

ExecutiveRoleSignificance of Removal
Sampath KumarGroup Head, Branch BankingOverseer of the entire branch network; his exit signals a major governance lapse.
Harsh GuptaExecutive Vice PresidentHead of Middle East, Africa, and NRI Onshore Business; the direct leader of the affected branches.
Payal MandhyanSenior Vice PresidentHeld accountable for oversight lapses in client onboarding and sales practices.

The bank stated that these terminations were “remedial actions” taken to address gaps in client onboarding and maintain internal compliance standards.


3. The Resignation of Atanu Chakraborty: An Ethical Stand?

While the AT1 bond probe was concluding, the bank suffered a second blow. On March 18, 2026, Part-time Chairman Atanu Chakraborty resigned with immediate effect.

His resignation letter contained a “poison pill” for the bank’s reputation:

“Certain happenings and practices within the bank, that I have observed over the last two years, are not in congruence with my personal values and ethics.”

Market Reaction and Governance Concerns

The phrasing of the letter—specifically the mention of “values and ethics”—triggered panic.

  • Stock Crash: HDFC Bank shares plummeted nearly 9% in a single day, hitting a 52-week low.
  • Valuation Wipeout: The bank’s market cap fell below 2020 pandemic levels, trading at a price-to-book (P/B) ratio of ~2.2x.
  • Board Response: To stabilize the ship, the Reserve Bank of India (RBI) approved Keki Mistry (former HDFC Ltd CEO) as the interim chairman for three months.

5. Regulatory Scrutiny: RBI and DFSA Actions

The fallout has not been limited to internal firings.

  • DFSA Restraint: The Dubai regulator has reportedly restricted HDFC Bank’s DIFC branch from onboarding new clients.
  • RBI Monitoring: While the RBI stated there are “no material concerns on record” regarding the bank’s overall financials, it has indicated it will continue to engage closely with the board.
  • Investor Lawsuits: Affected NRI clients are reportedly exploring legal options to recover the $100–$120 million lost in the AT1 bond write-down.

A table comparing the safety of traditional deposits versus the risk of AT1 bonds is a “value magnet” for readers.

Comparison: FCNR Deposits vs. AT1 Bonds

FeatureFCNR (Fixed Deposit)AT1 Bonds (Additional Tier-1)
Risk LevelLow (Bank-backed)Very High (Equity-like risk)
MaturityFixed (1–5 years)Perpetual (No fixed maturity)
Principal SafetyGuaranteed at maturityCan be written to ZERO
ReturnsFixed InterestHigher Coupon (10–13%)
LiquidityEasy premature withdrawalHard to sell during crises

Conclusion: A Turning Point for HDFC Bank?

The events of March 2026 mark the most significant leadership crisis since the HDFC-HDFC Bank merger. While the bank remains financially robust and well-capitalized, the “ethics storm” has bruised its image as the gold standard of Indian banking.

For investors, the key will be the findings of the external law firms and whether the bank can successfully pivot its culture from “aggressive sales” to “client suitability.”

HDFC Bank and TCS Lead Sensex Freefall to 52-Week Lows

hdfc bank and tcs

HDFC Bank and TCS Lead Sensex Freefall to 52-Week Lows

The Indian equity market witnessed one of its most turbulent sessions in recent history on Thursday, March 19, 2026. In a dramatic “risk-off” move, the BSE Sensex plummeted by nearly 2,500 points, closing at 74,207, while the Nifty 50 crashed over 770 points to settle at the psychological support level of 23,000.

The carnage was not merely a number on a screen; it represented a staggering erosion of over ₹11.5 lakh crore in investor wealth in a single day. Most notably, the “Big Boys” of the index—HDFC Bank and Tata Consultancy Services (TCS)—were among five prominent Sensex constituents that hit their 52-week lows, marking a significant sentiment shift for India’s most trusted blue-chip stocks.

The “Low” List: Five Stocks in the Eye of the Storm

While the entire market ended in the red, these five Sensex heavyweights reached their lowest price points in the last year, with some correcting as much as 16% in just 30 days.

Stock Name52-Week Low (Mar 19)Approx. 1-Month DeclineKey Triggers
Bajaj Finserv₹1,704.55~16%FII selling, hawkish Fed stance
Kotak Mahindra Bank₹363.10~14%Sectoral weakness, margin pressure
HDFC Bank₹772.00~13%Chairman resignation, FII outflows
TCS₹2,350.10~13%Global tech spend caution, AI concerns
ITC₹297.10~10%Profit booking, broader market drag

1. HDFC Bank: A Leadership Vacuum and Institutional Exit

HDFC Bank, the bellwether of the Indian banking sector, has faced a grueling month. The stock hit a fresh 52-week low of ₹772 today. The primary catalyst for the immediate 5% intraday drop was the sudden resignation of its part-time Chairman, Atanu Chakraborty, who cited “ethical concerns” in a regulatory filing.

For an institution built on the pillars of governance and stability, such a departure is a major red flag for Foreign Institutional Investors (FIIs). Combined with the heaviest fortnightly selling by FIIs in 17 years, HDFC Bank’s price action reflects a deep “trust deficit” that technical analysts believe may take months to mend.

2. TCS: The IT Titan Hits a Global Speed Bump

Despite announcing a significant strategic partnership with Amadeus to build next-gen airline solutions, TCS shares fell 3.2% to a 52-week low of ₹2,350.10.

The irony of the situation was not lost on the market: a global deal was announced, yet the stock tanked. This highlights the current “cautious and selective” mood. Investors are no longer rewarding “potential” deals; they are demanding visibility on immediate revenue. With the US Federal Reserve signalling “higher for longer” interest rates and a hawkish outlook on inflation, the discretionary tech spend by US enterprises is expected to remain tight, directly squeezing the margins of Indian IT majors.


The Macro Forces: Why the Market is Bleeding

To understand why these giants are falling, we must look at the “Perfect Storm” of global and domestic factors currently hitting Dalal Street.

The Crude Oil Shock

Brent crude prices have surged past $110 per barrel, touching $118 in some sessions. For an oil-importing giant like India, this is the ultimate “inflation tax.” High oil prices lead to:

  • Wider Current Account Deficit (CAD): Weakening the Rupee.
  • Rising Input Costs: Slashing corporate profit margins across sectors like Auto, Paints, and Aviation.

The Federal Reserve’s “Hawkish” Shadow

On March 18, the US Federal Reserve kept interest rates unchanged but increased its inflation outlook. This dashed hopes of early rate cuts, leading to a spike in US bond yields. When US yields rise, FIIs typically pull money out of emerging markets like India to seek “risk-free” returns in the US, leading to the massive sell-offs we are seeing in HDFC and TCS.

The Rupee at Record Lows

The Indian Rupee hit a historic low of ₹92.89 against the US Dollar today. While a weak rupee usually benefits IT exporters, the sheer scale of FII outflows (nearly $8 billion in recent weeks) has created a liquidity crunch that has overshadowed any currency-related gains for the IT sector.


Expert Insights: Distribution or Structural Breakdown?

The sharp correction has left retail investors wondering if this is a “buying opportunity” or a “falling knife.”

Ruchit Jain, Head of Equity Technical Research at Motilal Oswal Financial Services, notes:

“The index heavyweights have witnessed a sharp sell-off due to persistent FII selling. Until external data—geopolitical news, FII flows, and Crude prices—change direction, these stocks are likely to continue underperforming.”

On the other hand, Anshul Jain of Lakshmishree Research suggests that this phase reflects a “sentiment reset” rather than a structural collapse. He points out that historically, drawdowns of 15–25% in frontline large-caps like TCS and HDFC Bank often offer favorable entry zones for long-term “buy-and-hold” investors.


What Should Investors Do Next?

Navigating a market crash requires a balance of caution and conviction. Here is a professional roadmap for the current scenario:

  1. Avoid Catching the “Falling Knife”: Technical indicators like the RSI (Relative Strength Index) for many of these stocks are near 28 (oversold), but in a panic market, “oversold” can stay “oversold” for a long time. Wait for a base formation before entering.
  2. Monitor the “Psychological Floors”: For the Nifty 50, the 22,850–23,000 zone is critical. A decisive close below 23,000 could open the doors for a further slide toward 22,500.
  3. Focus on Cash-Rich Companies: In high-interest-rate environments, companies with low debt and high cash reserves (like many in the IT and FMCG sectors) are better positioned to survive the volatility.
  4. Watch the Geopolitical Pulse: The intensifying tensions in West Asia are the primary driver of oil volatility. Any signs of de-escalation could lead to a sharp “short-covering” rally.

Conclusion

The sight of TCS and HDFC Bank at 52-week lows is a stark reminder that even the most robust portfolios are not immune to global macro shifts. While the “blood on the streets” is painful for existing holders, it serves as a reality check on valuations that had perhaps become too stretched in early 2026.

For the disciplined investor, the key is not to panic but to watch for the stabilization of the Rupee and the cooling of oil prices as the first signals of a market bottom.

REC Limited Dividend 2026: Record Date, Yield, and ₹3.20 Payout Details

REC Limited headquarters showing ₹3.20 dividend announcement

REC Ltd Announces ₹3.20 Dividend for March 2026: Key Dates, Yield, and Performance Analysis

REC Limited, the Maharatna Power Finance PSU, has officially declared its fourth interim dividend for the financial year 2025-26. This announcement comes as a significant update for income-focused investors, reinforcing REC’s reputation as one of the most consistent dividend-paying stocks in the Indian market.

Below is a comprehensive breakdown of the dividend details, record dates, and an analysis of the stock’s current yield.


REC Dividend 2026: The Core Details

The Board of Directors of REC Limited, in their meeting held on March 16, 2026, approved a fourth interim dividend of ₹3.20 per equity share. This dividend represents 32% of the face value of ₹10 per share.

Key MetricDetails
Dividend Amount₹3.20 per share
Dividend Type4th Interim Dividend (FY 2025-26)
Face Value₹10.00
Record DateMarch 20, 2026
Ex-Dividend DateMarch 20, 2026
Payment DateOn or before April 14, 2026

Note for Investors: To be eligible for this payout, you must hold the shares in your Demat account before the market closes on the day prior to the Ex-dividend date.

2. Yield Analysis: Why REC Stands Out

At a current market price of approximately ₹332, the forward dividend yield remains one of the most attractive in the Nifty Midcap index.

  • Trailing 12-Month (TTM) Dividend: ~₹18.40 – ₹20.00 per share.
  • Current Dividend Yield: ~5.5% to 6.0%.
  • Payout Sustainability: REC maintains a payout ratio of roughly 25-30% of its net profits. Unlike many private firms that reinvest all capital, REC’s status as a PSU requires it to share a healthy portion of earnings with the government (the majority shareholder) and retail investors.

Investor Insight: While the stock price has seen a correction from its 52-week high of ₹444, the dividend yield has conversely increased. For value investors, this “price-yield inverse” often presents a buying opportunity, effectively getting more “income per rupee” invested.

3. Q3 FY26 Financial Snapshot: Stability Amid Volatility

Dividends are only as good as the profits that fund them. REC’s Q3 FY26 results (ended Dec 31, 2025) showcase a fortress-like balance sheet:

  • Net Profit: Stood at ₹4,043.08 crore, remaining steady year-on-year.
  • Asset Quality (The Star Performer): REC has undergone a massive cleanup of its books.
    • Gross NPA: Improved sharply to 0.88% (down from nearly 2% a year ago).
    • Net NPA: At an incredible 0.20%.
  • Provisioning Coverage Ratio (PCR): 76.96%, ensuring the company is well-protected against any potential loan defaults.
  • Capital Adequacy (CRAR): A robust 24.26%, far above the regulatory requirements.

This level of financial health is why 11 out of 14 market analysts currently maintain a “Strong Buy” rating on the stock, with target prices reaching as high as ₹458.

4. Strategic Evolution: Restructuring and “Viksit Bharat”

The biggest news surrounding REC in early 2026 isn’t just the dividend—it’s the Government’s Restructuring Plan. Announced in the Budget 2026-27, the government plans to restructure REC and its parent, PFC (Power Finance Corporation).

What this means for you:

  1. No Merger (For Now): The government has clarified that a full merger is unlikely due to RBI exposure limits. Instead, the focus is on operational synergy.
  2. Energy Transition focus: REC is shifting from purely “rural electrification” to “Green Financing.” It is now the primary lender for Green Hydrogen, EV infrastructure, and Battery Storage projects.
  3. Loan Book Growth: REC aims for a ₹10 lakh crore loan book by 2030. This suggests a CAGR of over 13% for the next four years, providing the growth “fuel” for future dividends.

5. Comparison: REC vs. PFC vs. IRFC

In the battle of the “Finance PSUs,” where does REC sit?

FeatureREC LtdPFCIRFC
Dividend Yield~5.8%~3.9%~2.2%
P/E Ratio~5.1~8.1~18.1
Asset QualityExcellent (Net NPA 0.20%)GoodSuperior (Zero NPA)
FocusPower/RenewablesPower/InfraRailways

Verdict: While IRFC is “safer” due to its zero-NPA model, REC offers a significantly higher dividend yield and lower valuation (P/E), making it the preferred choice for aggressive income seekers.

6. Potential Risks to Monitor

No investment is without risk. For REC, keep an eye on:

  • Interest Rate Fluctuations: As a lender, REC’s margins (NIMs) are sensitive to RBI rate changes.
  • Sector Concentration: Heavy exposure to the power sector means any policy shift in State Discoms can impact loan recoveries.
  • Market Sentiment: As a mid-cap PSU, it can be more volatile than large-cap stocks during global market sell-offs.

Final Takeaway

The ₹3.20 dividend is a testament to REC’s consistent cash-generating machine. With a record date of March 20, 2026, investors have a narrow window to position themselves for this payout. Combined with a clean balance sheet and a clear role in India’s “Viksit Bharat” 2030 vision, REC remains a cornerstone for any diversified Indian portfolio.

Reliance to invest in first new US oil refinery in 50 years, says Trump; calls $300 billion Texas project ‘historic deal’

Reliance

Trump Hails ‘Historic’ $300 Billion Texas Oil Refinery Deal with Reliance Industries: A New Era of Global Energy Dominance

In a move that has sent shockwaves through the global energy markets, U.S. President Donald Trump has announced a “historic $300 billion deal” to construct the first major new oil refinery in the United States in over 50 years. At the heart of this massive infrastructure project is an unprecedented partnership with India’s largest private-sector conglomerate, Reliance Industries (RIL), led by billionaire Mukesh Ambani.

The project, spearheaded by America First Refining (AFR), is set to be located at the Port of Brownsville, Texas. Trump characterized the development as a “massive win for American workers” and a cornerstone of his “America First” energy agenda, aimed at securing total energy independence amid escalating global geopolitical tensions.

Key Insights: Why This Deal Matters

  • End of a 50-Year Drought: This is the first “grassroots” refinery (built from the ground up) in the U.S. since 1977.
  • Massive Scale: The $300 billion figure represents the estimated total economic value of the 20-year offtake and production agreement.
  • Strategic Reliance Partnership: Reliance Industries is providing a “nine-figure investment” and has signed a binding 20-year agreement to purchase and distribute the refinery’s products.
  • Shale-Optimized Technology: Unlike older U.S. refineries designed for heavy foreign crude, this facility will process 100% American light shale oil.
  • Geopolitical Timing: The announcement comes as the Strait of Hormuz faces disruptions and oil prices hover near $100–$120 per barrel due to the conflict in West Asia.

The $300 Billion Vision: Breaking Down the Numbers

While the construction cost of a modern refinery typically ranges between $6 billion and $10 billion, the $300 billion valuation cited by President Trump encompasses the long-term trade impact and production value.

According to filings from America First Refining, the deal involves:

  1. Processing Power: The refinery will process roughly 1.2 billion barrels of U.S. light shale oil over two decades.
  2. Product Value: It is expected to produce 50 billion gallons of refined products (gasoline, diesel, and jet fuel) worth an estimated $175 billion.
  3. Trade Balance: The project is projected to improve the U.S. trade imbalance by $300 billion by reducing the need for imported refined products and boosting global exports.

“This is what American Energy Dominance looks like. We are streamlining permits and lowering taxes to bring billions of dollars back to our nation,” Trump stated via Truth Social.

Reliance Industries: The Global Powerhouse in Texas

The involvement of Reliance Industries is a masterstroke of global diplomacy and corporate strategy. Reliance already operates the world’s largest single-location refining complex in Jamnagar, India. By investing in the Brownsville project, Mukesh Ambani is effectively exported Reliance’s world-class refining expertise to American soil.

For Reliance, this move provides a critical hedge. As India faces its own energy challenges due to the Iran-Israel conflict, securing a 20-year supply chain of refined products from the U.S. ensures long-term stability for its global trading desk.

Why Brownsville, Texas?

The Port of Brownsville is strategically located near the Permian Basin, the most productive oil field in the U.S. By refining shale oil at the source, the new facility eliminates the “mismatch” currently plaguing the Gulf Coast—where 50-year-old refineries are often unable to efficiently process the light, sweet crude produced by the American shale revolution.

Economic Impact: Jobs and Energy Security

The Texas refinery is expected to be “the cleanest refinery in the world,” utilizing next-generation carbon-capture and hydrogen-ready technologies. Beyond environmental benchmarks, the economic ripples will be felt immediately:

  • Job Creation: Thousands of high-paying construction and engineering jobs are expected during the groundbreaking, scheduled for Q2 2026.
  • National Security: By processing domestic shale into fuel, the U.S. becomes less vulnerable to “actuarial warfare”—where maritime chokepoints like the Strait of Hormuz can be closed by rising insurance costs or military conflict.
  • Consumer Relief: Though the refinery will take years to become fully operational, the announcement serves as a signal to markets that long-term supply is being addressed, potentially stabilizing volatile gas prices.

Technical Innovation: “The Cleanest Refinery in the World”

While critics often argue that new oil infrastructure is a step backward for the environment, America First Refining has countered this by positioning the Brownsville plant as a Green-Refining Hybrid.

Key technical features include:

  • Hydrogen Integration: The facility will use green hydrogen for the desulfurization process, significantly reducing its carbon footprint.
  • Zero-Liquid Discharge: Advanced water recycling systems will ensure that no industrial wastewater is released into the local ecosystem—a critical promise for the delicate coastal environment of South Texas.
  • Modular Design: Unlike the sprawling, inefficient plants of the 1970s, this refinery uses a modular architecture that allows for rapid construction and future upgrades for biofuels or synthetic fuels.

The “Trump-Ambani” Synergy: A Match Made in Energy Heaven

The partnership between Donald Trump and Mukesh Ambani represents a fusion of “America First” nationalism and “Global India” ambition. Ambani’s Reliance Industries is not just a passive investor; they are the operators of the future.

Reliance’s Jamnagar complex is a marvel of engineering that operates at over 100% capacity and can process almost any type of crude. By bringing this operational excellence to Texas, Reliance is helping the U.S. overcome its “infrastructure amnesia”—the loss of technical know-how that occurs when an industry goes 50 years without building a new flagship facility.

Market Reaction: Why RIL Stock Dipped Despite the News

Interestingly, while the news is “historic,” Reliance Industries (RIL) shares saw a slight 0.5% dip on the NSE following the initial 2% rally. Financial analysts suggest this is a “wait-and-see” reaction from institutional investors.

  • Capital Expenditure Concerns: A project of this magnitude requires significant upfront cash. Investors are looking for clarity on the debt-to-equity ratio Reliance will use for its “nine-figure” investment.
  • Timeline Risks: Building a refinery takes years. While the Q2 2026 groundbreaking is ambitious, regulatory hurdles and construction delays are common in large-scale energy projects.
  • Long-Term Offtake: The 20-year binding agreement is a double-edged sword. It guarantees revenue, but it also locks Reliance into a specific pricing structure in a world where the energy transition is accelerating.

Regional Impact: South Texas as the New “Silicon Valley of Energy”

The Port of Brownsville and the surrounding Rio Grande Valley have long been overlooked in the Texas energy boom. This deal changes that overnight.

  • Thousands of Jobs: The project is expected to create 10,000+ construction jobs and 1,500 permanent high-skilled roles.
  • Economic Opportunity Zone: Being located in a designated Opportunity Zone, the project provides massive tax incentives for the developers while bringing infrastructure like new roads, power grids, and housing to the local community.
  • Education and Training: Local universities and trade schools in South Texas are already preparing to launch specialized “Refinery Tech” programs to feed the workforce pipeline.

Final Verdict: A $300 Billion Gamble on the Future of Oil

As we move deeper into 2026, the Reliance-Texas deal stands as a bold bet that oil will remain the bedrock of global power for decades to come. By combining American resources with Indian refining expertise and Trump’s deregulatory “America First” policies, this project aims to rewrite the rules of the energy market.

It is a deal of superlatives: the first in 50 years, the biggest in history, and potentially the most consequential for the 21st-century global economy.

Asian Paints, Berger Drop Up to 5% After 29% Oil Spike Amid Middle East Tensions

ASIAN PAINTS
BERGER PAINTS

Paint Industry

The paint industry plays a crucial role in modern economies, contributing significantly to the aesthetic enhancement of both residential and commercial spaces, as well as providing vital protective coatings for various substrates. This industry is generally categorized into two main segments: decorative paints and industrial paints. Decorative paints, which include interior and exterior wall coatings, are primarily aimed at homeowners and businesses looking to enhance their environment. On the other hand, industrial paints are utilized in manufacturing and maintenance applications, offering protection against corrosion, weathering, and chemical exposure.

In recent years, the paint industry has witnessed substantial growth driven by rising urbanization, increased disposable incomes, and a growing emphasis on sustainability. Leading players like Asian Paints and Berger Paints have been instrumental in defining industry standards and consumer preferences. Asian Paints, for instance, has established itself as a market leader in the decorative paint segment through innovative product offerings and extensive distribution networks. Berger Paints, while also prominent, has carved out a niche by focusing on unique solutions that address specific consumer needs.

As the industry evolves, trends such as eco-friendly paint formulations and technological advancements in paint application have emerged. With consumers becoming more environmentally conscious, paint manufacturers are increasingly investing in products that minimize environmental impact without compromising quality. This shift not only reflects changing consumer preferences but also highlights the importance of adaptability among leading firms in the paint sector.

Company Profiles: Asian Paints and Berger Paints

Asian Paints, established in 1942, has grown to become one of the leading paint companies in Asia. Founded by a group of friends, the company started its journey by manufacturing paints and has since evolved into a multi-national corporation with operations in 15 countries. Its mission revolves around bringing color and creativity to people’s lives, aligning with a vision of providing innovative and customer-focused solutions. Over the years, Asian Paints has expanded its product range, including decorative paints, industrial coatings, and home improvement solutions, showcasing a commitment to quality and diversity.

The company’s key milestones include the introduction of its own distribution network, which revolutionized the way paints are sold in India, making them highly accessible to customers. Moreover, Asian Paints is renowned for its innovations such as the Color Visualizer tool that allows customers to envision their spaces with different shades, thus enhancing the buying experience. As a pioneer in the paint industry, Asian Paints is also known for its sustainability efforts, which focus on eco-friendly products and practices.

On the other hand, Berger Paints has a rich history dating back to 1760, originally founded in the UK before entering the Indian market in 1923. The company has since established itself as a trusted name in the painting sector, committed to delivering superior quality products. Berger’s mission emphasizes its dedication to sustainable practices and technology-driven solutions, inspiring trust through innovation. Its wide product range spans various categories such as enamels, emulsions, and construction chemicals, catering to both residential and industrial sectors.

Among Berger Paints’ notable achievements is the launch of a unique color shade card, allowing consumers a versatile choice. Furthermore, the company prides itself on consistent growth and a robust market presence, establishing itself as a key player in the paint segment. Berger’s customer-centric approach and commitment to excellence have solidified its position in the competitive market, appealing to diverse consumer needs.

Product Offerings: A Detailed Comparison

When comparing the product offerings of Asian Paints and Berger Paints, it is essential to examine the various categories such as emulsions, enamels, and primers, to understand their unique selling propositions and quality features.

Asian Paints offers a wide range of emulsion paints, which are known for their high performance and durability. Their Royal Smooth Emulsion is particularly popular for its smooth finish and excellent washability. The Apcolite Premium Emulsion is another prominent product, designed to provide an appealing aesthetic with a broad spectrum of colors, making it suitable for both interiors and exteriors.

In contrast, Berger Paints also provides a strong lineup of emulsion paints, such as the Berger Silk range, which emphasizes a soft sheen and is marketed for its superior stain resistance. Additionally, their Easy Clean series focuses on providing an easy-to-clean surface, ideal for families and high-traffic areas.

Beyond emulsions, both brands also offer a variety of enamel paints. Asian Paints has the Asian Paints Enamel, known for its quick-drying properties and vibrant finish. This product is particularly suited for furniture and metal surfaces. Conversely, Berger Paints features the Berger Non-Drip Enamel, which has been formulated to minimize dripping and running during application, enhancing the user experience.

For primers, Asian Paints provides solutions like the Wood Primer and Quick Dry Primer, both targeting different substrates to ensure optimal adhesion and coverage. Berger Paints counters with its Berger Primers, which focus on sealing porous surfaces and providing a strong base for topcoats, demonstrating both brands’ commitment to quality and performance.

In essence, both Asian Paints and Berger Paints offer compelling product lines, catering to diverse consumer needs while maintaining a focus on quality. Whether one opts for Asian Paints or Berger Paints, the selection provides a range of choices that meet modern demands in the paint industry.

Innovations and Technologies Used by Each Brand

The paint industry has witnessed significant advancements in innovation and technology, with both Asian Paints and Berger Paints continuously enhancing their manufacturing processes to meet consumer demands. Asian Paints has pioneered the development of various eco-friendly products, which reflect a growing commitment to sustainability. For instance, the introduction of water-based paints helps reduce harmful emissions while maintaining high-quality standards. Furthermore, Asian Paints utilizes advanced manufacturing techniques, such as their state-of-the-art automated plants, to streamline production while ensuring consistency in color and texture.

On the other hand, Berger Paints has made considerable strides in innovation, focusing on digital solutions and smart technology. The brand has embraced technology through the launch of the Berger Paints app, which allows consumers to visualize how different paint colors would look in their homes. This application not only enhances the customer experience but also places Berger Paints at the forefront of digital transformation in the paints industry. Moreover, the company is also engaged in the creation of low-VOC (Volatile Organic Compounds) paints, further promoting health and environmental consciousness among users.

Both brands have also explored the realm of advanced application methods. Asian Paints has introduced airless spray equipment, which offers a smooth finish and reduces paint wastage, making the process more efficient. Similarly, Berger Paints has prioritized research and development to innovate products that cater to specific market needs, such as anti-bacterial paints and quick-drying solutions tailored for both residential and commercial applications. As consumer preferences evolve, it is evident that both Asian Paints and Berger Paints are committed to leveraging technology to deliver superior products and enhance overall customer satisfaction, thereby reinforcing their positions as leaders in the industry.

Pricing strategies are crucial in determining a brand’s market position and consumer perception. Asian Paints and Berger Paints both adopt distinct pricing approaches to cater to their target market segments while considering production costs, competition, and consumer demand.

Asian Paints utilizes a tiered pricing strategy across various product divisions. Their offerings range from budget-friendly paints suitable for residential use to premium products designed for high-end applications. This segmentation allows consumers to choose a product that best suits their financial capabilities while maintaining quality. Additionally, Asian Paints frequently employs promotional strategies including discounts, bundled offers, and seasonal campaigns which further enhance their appeal in a competitive landscape.

In contrast, Berger Paints tends to focus on providing value for money while maintaining a slightly lower price range compared to Asian Paints. Their pricing strategy emphasizes affordability without compromising on quality. Berger often implements targeted promotions and initiatives to attract budget-conscious consumers and DIY enthusiasts. This approach effectively positions Berger as a brand that provides reliable performance at a more accessible price point.

The competition between Asian Paints and Berger Paints is not solely based on pricing but also on the perceived value of their products. Consumers often weigh durability, finish, and brand reputation against the cost, which can significantly influence their purchasing decisions. As both companies continue to innovate, understanding their pricing strategies becomes essential for consumers looking for the best value in their paint purchases.

Ultimately, the pricing strategies of Asian Paints and Berger Paints reflect their commitment to meet diverse consumer needs while adapting to market trends. Their respective tactics in pricing and promotions shape how each brand is perceived within the industry, influencing consumer choices and brand loyalty.

Market Presence and Distribution Channels

When examining the market presence of Asian Paints and Berger Paints, a crucial aspect to consider is their distribution channels. Both companies have established extensive networks that cater to a diverse customer base, but their strategies in navigating online versus offline sales differ significantly.

Asian Paints maintains a dominant position in the market, attributed largely to its robust distribution methods. The company has partnered with numerous retailers and distributors, ensuring its products are readily available across urban and rural areas alike. Moreover, Asian Paints has embraced the e-commerce revolution, with a strong online presence that enlists various platforms to reach consumers effectively. Their online channels not only facilitate direct sales but also provide customers with valuable information and a comprehensive selection process.

On the other hand, Berger Paints operates with a slightly different approach, focusing heavily on traditional retail partnerships. Although they have begun to enhance their online presence, their strength lies mainly in building strong relationships with local dealers. This offline strategy allows them to maintain a solid grasp on market trends and consumer preferences in different regions. As a result, Berger Paints often relies on physical stores to promote customer engagement and provide personalized services, encouraging feedback and fostering loyalty.

The contrasting distribution strategies of both companies impact their availability and customer accessibility significantly. Asian Paints’ omnichannel approach provides a level of convenience for consumers who prefer to browse online before purchasing. Conversely, Berger Paints’ emphasis on offline retail allows for a localized touch, giving customers more tailored support and experiences. Ultimately, these operational strategies reflect their respective market positioning and customer engagement methodologies, catering to an evolving industry landscape.

Customer Perception and Brand Loyalty

Customer perception of brands can significantly influence their loyalty and repeat purchases. In the case of Asian Paints and Berger Paints, both companies are well-regarded within the Indian paint industry but have distinct reputations shaped by various factors including quality, pricing, and customer service. Asian Paints has established itself as a market leader, bolstered by a consistent focus on innovation and customer engagement which resonates well with consumers across different demographics. Customers often praise the wide array of colors and finishes offered by Asian Paints, indicating a strong appreciation for the brand’s aesthetic appeal.

Conversely, Berger Paints has made notable strides in customer satisfaction, often marked by competitive pricing and promotional offers. Many customers express loyalty towards Berger for its value for money proposition, especially in rural and semi-urban areas. Reviews on various platforms highlight that Berger Paints is perceived as a reliable choice, with a reputation for providing decent quality products at an accessible price point. This positioning has garnered Berber Paints a steady customer base that prioritizes affordability alongside performance.

Social media also plays a pivotal role in shaping customer perceptions of both brands. Consumers frequently engage with these companies through platforms like Instagram and Facebook, where brand reputation can be elevated or diminished based on public feedback. Both Asian Paints and Berger Paints actively utilize social media to showcase their products and interact with customers, utilizing feedback to enhance their offerings. Effective handling of customer queries has resulted in positive brand encounters that strengthen consumer trust.

Quantitative metrics, such as brand recognition surveys, further illustrate the loyalty trends for both companies. Asian Paints often ranks higher in brand recall among urban consumers, while Berger Paints maintains significant traction in less urbanized regions. This dynamic underscores how diverse market segments perceive these brands differently, influenced by varying socioeconomic contexts.

Case Studies: Successful Projects and Collaborations

Asian Paints and Berger Paints are both leading players in the decorative coatings industry, known for their innovative approach and contribution to enhancing architectural aesthetics. Their substantial portfolios include case studies that exemplify collaboration with designers and architects, reinforcing their status within the market.

One notable project for **Asian Paints** includes their partnership with renowned architect Sanjay Puri for the ‘The Hotel of Tomorrow’ in Mumbai. This project showcases a blend of innovative design and functionality, where Asian Paints provided customized solutions that perfectly complemented the hotel’s modern architecture. The color palettes chosen emphasized the hotel’s overall ambiance, demonstrating how the aesthetic qualities of paint can transform a space. Furthermore, this collaboration showcases Asian Paints’ commitment to sustainability by using environmentally friendly products.

On the other hand, **Berger Paints** has established itself as a trusted name through various collaborations, such as the recent initiative with designer Gauri Khan to create a unique decorative paint collection. This collaboration was showcased at the annual India Design ID exhibition, where Berger Paints unveiled a series of exclusive shades tailored to contemporary interiors. These products not only reflect the artistic vision of Gauri Khan but also leverage Berger Paints’ technical prowess to ensure durability and ease of application.

Both **Asian Paints** and **Berger Paints** have demonstrated their capabilities through these successful projects, effectively collaborating with industry experts to provide products that meet the evolving demands of modern architecture and design. The practical applications of their paints in various renowned projects illustrate the capability of both brands to adapt to customer preferences while maintaining their commitment to quality.

Conclusion: Who Comes Out on Top?

In the landscape of decorative paints, both Asian Paints and Berger Paints have carved out notable identities, each with distinct strengths and weaknesses. Asian Paints stands as a leader in the market due to its extensive range of products, innovative solutions, and strong brand reputation. Its commitment to quality and continuous improvement has earned it a loyal customer base. On the other hand, Berger Paints offers a robust portfolio with its competitive pricing and reliable options, making it an attractive choice for budget-conscious consumers.

When considering which brand might be more suitable, it largely depends on the specific needs and preferences of the consumer. For those prioritizing variety and premium finishes, Asian Paints could be the optimal choice. Its advanced technology and user-friendly products cater effectively to diverse customer demands, whether for residential or commercial projects. Additionally, the brand is renowned for its exceptional durability and extensive color palette.

Conversely, if cost-effectiveness and accessibility are primary factors, Berger Paints provides a strong alternative. Its focus on delivering quality stains and low-price options helps consumers achieve their painting goals without significant investment. Bergers’ products are known for their easy application and decent longevity, appealing to DIY enthusiasts and professional painters alike.

Ultimately, the decision between these two brands should be guided by individual project requirements, such as durability, finish, and budget constraints. It is advisable to assess personal preferences and project specifications before making a choice. Based on this comprehensive analysis, both brands hold their own merits, ensuring consumers can find a suitable option tailored to their unique needs.

Foreign Investors Sell Around ₹11,000 Crore of Indian Stocks in Two Days as US-Iran War Drives Market Pressure

Foreign Investors

Foreign Investors Sell Around ₹11,000 Crore of Indian Stocks

In the context of global finance, foreign investments play a pivotal role in shaping economies, with Indian stocks drawing significant attention from international investors in recent years. However, geopolitical tensions, such as the recent conflict between the United States and Iran, have led to notable fluctuations in foreign investment patterns. These tensions have triggered a ripple effect, provoking concerns among investors regarding the stability and attractiveness of emerging markets, particularly in India.

The US-Iran conflict has intensified due to several factors, including political maneuvers and regional security issues. As the situation unfolded, investors have become increasingly cautious, leading to a trend of capital outflows from Indian equities. The unpredictability stemming from such geopolitical strife often forces foreign investors to reassess their exposure to riskier assets, prompting them to withdraw investments in pursuit of safer havens.

This unfolding dynamic poses significant implications for the Indian stock market, as it relies heavily on foreign capital for financing and growth. Diminishing foreign investment can result in increased volatility, diminished liquidity, and a potential downtrend in stock prices, which collectively undermine market confidence. The investor sentiment during periods of heightened geopolitical tension can drive market movements, creating challenges for equity valuations and overall economic stability.

Thus, understanding the correlation between foreign investments and geopolitical events is essential, not only for market analysts but also for stakeholders in the Indian economy. The repercussions of the US-Iran conflict extend beyond mere capital flows; they influence broader investment climates and signal the resilience of markets under pressure. Consequently, exploring these interactions provides crucial insights into potential future developments within the Indian stock market.

The Indian stock market has displayed notable fluctuations in recent weeks, largely attributed to geopolitical tensions between the US and Iran. These tensions prompted a wave of reaction from foreign institutional investors (FIIs), culminating in a substantial pullback from the Indian equities market. The Nifty 50 and Sensex, two of the primary benchmarks representing the overall market, experienced a pronounced decline that reflects investor sentiment amidst rising global uncertainties.

As foreign institutional investors withdrew considerable capital, the selling pressure translated into a sharp decrease in share prices across various sectors. Notably, the financial and energy sectors faced the brunt of this selling spree, as investors quickly recalibrated their portfolios in response to escalating geopolitical risks. The sharp downturn, influenced by FIIs’ actions, underscores the interconnectedness of the global market, where events far from Indian shores can significantly impact local stock performance.

This trend was characterized by a marked increase in market volatility, evident in the fluctuations observed in key indices. For instance, the Nifty 50 index dropped by nearly 4% over a week, illustrating the swift reaction of the market participants. Additionally, the volatility index (VIX) surged, highlighting the heightened anxiety among investors concerning future market movements.

The overall market performance illustrates a distinct trend driven by external factors and investor behavior, with FIIs taking a more cautious stance. As the geopolitical landscape continues to evolve, monitoring these trends becomes essential for investors and analysts alike, providing insights into the resilience of the Indian market against global pressures.

Role of Foreign Institutional Investors (FIIs)

Foreign Institutional Investors (FIIs) play a significant role in shaping the dynamics of the Indian stock market. These investors have been a crucial source of capital, bringing in funds from international markets to invest in various segments of the Indian economy. However, the ongoing geopolitical tensions between the United States and Iran have led to notable shifts in their investment patterns, with a marked increase in selling activity observed over recent months.

According to data from various financial agencies, FIIs have cumulatively withdrawn around INR 30,000 crore from the Indian stock market in the last quarter alone. This withdrawal is particularly alarming considering the historical context; it marks one of the largest outflows recorded in recent years. The hesitance to invest stems from heightened concerns regarding the potential for escalating conflicts which could adversely affect global markets and, by extension, the Indian economy.

The trend of FIIs pulling out investments has become evident in several sectors, most notably in consumer goods and technology stocks, which have historically attracted significant foreign capital. In comparison to the previous years, where investments were on a steady rise, the recent months have illustrated a clear pivot towards risk aversion among these investors. Historical data indicates that FIIs typically reassess their portfolio strategies during times of geopolitical instability, resulting in increased volatility in the stock market.

This retreat by FIIs not only threatens immediate liquidity but also undermines long-term growth prospects for various sectors within India. The ramifications are significant, as foreign investments have been pivotal for economic development and market confidence. As geopolitical tensions evolve, it remains to be seen how FIIs will adjust their strategies moving forward and whether they will find new opportunities within the Indian market.

Influence of Geopolitical Events

Geopolitical events have historically played a significant role in shaping the landscape of global financial markets, and the ongoing tensions between the United States and Iran serve as a primary example of this phenomenon. Investors closely monitor such conflicts because they can trigger fluctuations in market confidence, often resulting in rapid changes in stock prices and overall market indices. The reactions can be particularly pronounced in emerging markets like India, which has become increasingly integrated into the global economy.

Consider the sharp reactions observed during previous geopolitical crises, such as the Gulf War and the financial fallout from events like 9/11. During these instances, the uncertainty generated often led to a flight to safety by investors, resulting in heightened volatility in equity markets. The Indian stock market, sensitive to global cues, experienced similar pressure, as investors reevaluated risk exposure amidst fear of economic repercussions stemming from these geopolitical tensions.

Currently, as tensions escalate between the US and Iran, various sectors in the Indian market could experience the spillover effects of these geopolitical strains. Oil prices, for example, are highly susceptible to fluctuations based on geopolitical stability in oil-producing regions. A spike in oil prices could adversely impact sectors reliant on energy, thereby influencing stock valuations across the board. Additionally, other sectors such as defense, infrastructure, and even technology could be indirectly affected due to shifts in government spending or changes in foreign policy.

Understanding these historical precedents allows investors to better navigate the complexities of market reactions to geopolitical events. The interplay between global tensions and local markets underscores the necessity of staying informed and adaptable in investment strategies, as past events illuminate the potential volatility that can arise from international crises.

Domestic Institutional Investors (DIIs) Response

In the context of fluctuating market conditions triggered by US-Iran tensions, Domestic Institutional Investors (DIIs) have played a pivotal role in stabilizing the Indian stock markets. As Foreign Institutional Investors (FIIs) exhibited significant selling pressure, DIIs countered this trend by increasing their buying activity, reflecting their strategic importance in maintaining market equilibrium during times of volatility.

The response from DIIs can be attributed to their long-term investment strategies aimed at absorbing shocks in the market. Typically, DIIs consist of entities like mutual funds, insurance companies, and pension funds, all of which often adopt a more measured approach compared to their FII counterparts. During recent sell-offs, DIIs have strategically focused on acquiring quality stocks, thereby providing necessary support to the market when foreign investors were fleeing amid geopolitical uncertainty.

Recent data suggests that DIIs have been net buyers over several sessions, which has not only helped in cushioning the market downturn but also instilled a sense of confidence among retail investors. This shift indicates a persuasive trend where domestic funds are capitalizing on attractive valuations stemming from panic selling initiated by external factors. Moreover, this behavior underscores the capability of DIIs to act as stabilizers in the market, maintaining liquidity and facilitating a more gradual recovery from sharp declines.

The ongoing engagement of DIIs during periods of uncertainty illustrates their fundamental role in India’s financial ecosystem. As markets continue to face turbulence, the commitment of domestic investors to build positions suggests optimism in the long-term growth trajectory of the Indian economy, despite the pressures exerted by external geopolitical factors. Their proactive investment can also encourage other market participants to engage more robustly, further reinforcing the resilience of Indian equity markets.

Analysis of Current Economic Climate

The economic climate in which the Indian stock market operates is influenced by several interconnected factors, including inflation rates, interest rates, and projections of domestic economic growth. Each of these elements plays a critical role in determining market stability and investor confidence, and can significantly affect stock valuations.

Firstly, inflation rates in India have been fluctuating, primarily influenced by global commodity prices and local supply chain disruptions. A rising inflation rate can erode consumers’ purchasing power, leading to lower consumption growth, which conceivably impacts corporate earnings and, by extension, stock prices. Investors remain cautious as high inflation can prompt the Reserve Bank of India (RBI) to implement tighter monetary policies, increasing interest rates to curb price rises.

Interest rates are another vital component of the current economic landscape. The RBI’s monetary policy decisions are closely watched by investors, as shifts in interest rates can affect borrowing costs for businesses and consumers alike. An increase in interest rates typically leads to a higher cost of capital, which can stifle investment and slow economic growth. Conversely, lower rates tend to encourage borrowing and spending, hence fostering growth that is conducive to a bullish stock market.

Furthermore, projections for domestic economic growth can significantly influence market sentiment. Current forecasts indicate a mixed outlook amidst the persisting uncertainties created by geopolitical tensions, including those between the U.S. and Iran. Factors such as infrastructural investments, government policies, and global economic trends also play crucial roles in shaping investor expectations. Ultimately, the interconnectedness of these elements indicates a dynamic and sometimes volatile relationship with market performance, highlighting the fragility and resilience of the Indian stock market amidst foreign sell-offs.

Investor Sentiment and Market Psychology

Investor sentiment plays a crucial role in shaping market behavior, particularly during periods of uncertainty, such as geopolitical tensions. The relationship between investor psychology and market movements is well-established, as fear and uncertainty can significantly influence decision-making processes among market participants. When events like these unfold, the immediate reaction often encompasses anxiety and pessimism, leading to increased volatility in stock prices.

The backdrop of US-Iran tensions serves as an optimal case to illustrate how geopolitical factors can alter investor perspectives. Investors typically respond to such crises with heightened caution, often leading to a sell-off in equities as they seek to mitigate perceived risks. This response is predicated on the belief that instability may negatively impact economic conditions, affecting profitability and, consequently, stock prices.

A notable consequence of this reaction is the phenomenon termed ‘panic selling,’ where investors hurriedly divest their assets in response to market fluctuations, exacerbating downward pressure on stock prices. The fear of loss often overrides fundamental analysis, prompting a departure from rational investment strategies. Consequently, stocks that may have strong underlying fundamentals could be adversely affected due to widespread fear.

Contrarily, amid uncertainty, there may arise opportunities for contrarian investors who capitalize on weakened stock prices, driven by the prevailing fear in the market. This creates a landscape where anxiety leads to both challenges and opportunities, depending on the investor’s perspective. Insights gleaned during such turbulent times highlight the necessity for a grounded approach in investment strategies, emphasizing the importance of solid fundamentals over emotionally driven decisions.

Understanding investor sentiment helps market analysts predict future movements more accurately. By observing trends in investor behavior during times of geopolitical strain, one can better navigate potential market outcomes. Hence, assessing psychological factors alongside financial data is instrumental in formulating effective investment strategies and anticipating market reactions.

Future Implications for Indian Stocks

The Indian stock market is poised for a range of potential trajectories influenced by the ongoing tensions between the United States and Iran. As global uncertainties escalate, Indian investors must navigate a landscape shaped by international relations, domestic fiscal policies, and evolving geopolitical dynamics. One scenario that could unfold is a cautious recovery in Indian stocks, contingent upon stabilization in global markets and improved diplomatic engagements. If the US-Iran conflict resolves amicably, there may be a subsequent reduction in oil price volatility, which would favor the broader Indian economy and potentially boost investor confidence.

Conversely, sustained tensions could perpetuate a climate of uncertainty, resulting in continued volatility within the Indian stock markets. Investors are likely to monitor developments closely for any signs of escalation in conflict, which may trigger abrupt market reactions. Additionally, sectors that are sensitive to oil price fluctuations, such as transportation and manufacturing, could face challenges, influencing overall market performance. Global investors often react to geopolitical events, impacting foreign direct investment and portfolio flows, further complicating the outlook for Indian equities.

Moreover, fiscal policies enacted by the Indian government in response to external pressures may play a pivotal role in shaping market sentiments. Policy measures that enhance infrastructure development, promote manufacturing, or stimulate consumption could provide a counterbalance to external geopolitical threats. Hence, stakeholders must remain vigilant, assessing both domestic and international developments to navigate the future of Indian stocks effectively. The interplay between foreign relations and fiscal strategies will likely influence market sentiments significantly over the coming months.

Conclusion and Key Takeaways

In examining the impact of US-Iran tensions on Indian stocks, it is crucial to recognize the intricate dynamics at play within the financial markets. Investors have witnessed firsthand how geopolitical events can trigger volatility, thereby influencing investment decisions and market valuations. This situation has underscored the importance of remaining informed about global news and understanding its implications on local markets, particularly in a country like India, which is heavily intertwined with both international oil prices and foreign investments.

One of the main takeaways from this analysis is the correlation between oil prices and stock market performance in India. As tensions escalate, crude oil prices often rise, causing a ripple effect across various sectors of the Indian economy. Companies reliant on oil, whether as primary suppliers or those impacted by rising fuel costs, have shown a propensity for increased stock volatility. Therefore, stakeholders should closely monitor developments in US-Iran relations, as any significant change can either bolster or hinder stock performance.

Another critical insight is the need for diversification in investment portfolios. Given that geopolitical risks can take an unpredictable toll on markets, investors are advised to spread their investments across different sectors and asset classes to mitigate potential losses. Furthermore, adopting a long-term perspective may be more beneficial than reacting immediately to short-term market fluctuations driven by geopolitical strife.

In summary, the interplay of US-Iran tensions and their consequences on Indian stocks serves as a reminder of the interconnectedness of global economies. Investors and stakeholders must not only analyze market trends but also stay vigilant about external factors that could sway market sentiment. Ultimately, a proactive approach to investment, complemented by a thorough understanding of geopolitical affairs, is essential in navigating these turbulent waters.

SEBI Fines Coffee Day Enterprises ₹38 Lakh Over Financial Disclosure Lapses

SEBI
SEBI Fines Coffee Day Enterprises ₹38 Lakh Over Financial Disclosure Lapses

Recently, the Securities and Exchange Board of India (SEBI) has taken decisive action against Coffee Day Enterprises, imposing a monetary penalty of ₹38 lakh due to lapses in financial disclosures. This enforcement action highlights ongoing concerns regarding corporate governance and compliance within the Indian financial ecosystem. Coffee Day Enterprises, known predominantly for its coffee retail business, has come under scrutiny following a comprehensive investigation into its financial reporting practices.

The key findings from the SEBI investigation indicate significant discrepancies in the manner in which the company reported its financial activities. The regulator identified that the lapses not only hindered the transparency expected from a publicly traded company but also raised questions regarding the integrity of its financial statements. Such breaches not only affect investor confidence but could also lead to larger implications for the company’s stakeholders.

This penalty serves as a stern reminder to other corporations about the critical importance of adhering to financial disclosure norms. SEBI’s actions reflect its commitment to maintaining a robust regulatory framework aimed at protecting investors and ensuring accountability among listed entities. The significance of this investigation is amplified by the backdrop of Coffee Day Enterprises’ recent challenges, raising public interest in how the company addresses these compliance failures.

In light of these developments, industry observers will be closely monitoring how Coffee Day Enterprises responds to this penalty, particularly in terms of reinforcing its compliance structures and enhancing its transparency with stakeholders. The regulatory scrutiny is not just limited to the financial figures; it also encompasses broader aspects of corporate governance that are essential for the sustainable growth of businesses in India’s evolving market landscape.

Overview of the Investigation

The Securities and Exchange Board of India (SEBI) launched a comprehensive investigation into Coffee Day Enterprises, focusing on financial disclosures from the fiscal years 2020 to 2024. This inquiry was prompted by potential violations of regulatory provisions associated with the company’s reporting practices. The investigation’s timeline began with a preliminary assessment of the financial statements and disclosures submitted by Coffee Day Enterprises during this period.

SEBI’s scrutiny aimed to identify discrepancies in the reported financial results that could mislead investors or obscure the true financial health of the company. The investigation included a meticulous examination of income statements, balance sheets, and cash flow statements, in addition to evaluating the adherence of these documents to the necessary compliance frameworks. Key financial indicators were assessed to ascertain whether they truthfully reflected the company’s operations and profitability.

Furthermore, SEBI was particularly concerned about potential irregularities in the reporting of related party transactions and the appropriateness of valuations reflected in the financial records. The regulator’s mandate is to ensure that companies uphold transparency and accountability in their financial dealings, thereby protecting investors’ interests.

Throughout this investigation, SEBI gathered evidence, conducted interviews, and reviewed financial records in great detail. This rigorous process reflects the importance of corporate governance and regulatory compliance in maintaining investor confidence in the financial markets. The findings of this investigation ultimately culminated in a financial penalty, highlighting the crucial role of regulatory oversight in fostering ethical business practices.

Details of the Penalty

In recent developments, the Securities and Exchange Board of India (SEBI) imposed a penalty of ₹38 lakh on Coffee Day Enterprises Ltd. and nine of its officials due to significant lapses in financial disclosures. This financial penalty is aimed at ensuring that companies adhere to regulations that promote transparency and integrity in their financial reporting. The fines were determined after a thorough examination by SEBI, which highlighted various instances where Coffee Day Enterprises failed to maintain adequate disclosure standards.

The ₹38 lakh penalty reflects the severity of the breaches identified. SEBI assessed the nature and frequency of the non-compliance, considering factors such as the duration of the lapses and the potential impact on investors and market participants. By imposing this financial penalty, SEBI seeks to deter similar behavior in the future and uphold the sanctity of the regulatory framework governing corporate disclosures.

The implications of such a penalty for Coffee Day Enterprises are multifaceted. Firstly, the financial burden imposed by this ₹38 lakh fine could affect the company’s profitability and operational capacity, necessitating a review of its current governance policies and practices. Furthermore, the penalty may lead to reputational damage for both the company and the nine officials involved. Stakeholders may view this as a signal that the management lacks diligence in ensuring compliance with regulatory standards, potentially undermining confidence among investors and clients.

Additionally, this incident serves as a precedent in the sector, indicating to other corporations the importance of maintaining stringent financial disclosure practices. Non-compliance could lead to similar or even more severe penalties, thus emphasizing the need for enhanced oversight and internal controls within organizations to safeguard against regulatory infractions.

Allegations of Misreporting

The recent scrutiny faced by Coffee Day Enterprises has brought to light serious allegations regarding the misreporting of their financial results. The Securities and Exchange Board of India (SEBI) launched an investigation following claims that the company had not accurately represented its financial health, potentially misleading investors and stakeholders. This scrutiny arose particularly in relation to the company’s financial disclosures during critical reporting periods.

Key findings from the investigation revealed multiple instances where Coffee Day Enterprises had provided misleading information concerning their revenue and profits. The discrepancies ranged from inflated income figures to misclassification of expenses, which, when aggregated, significantly affected the perceived financial landscape of the company. Such lapses are concerning, especially in an industry that thrives on transparency and accurate reporting.

One notable issue identified was the inconsistency in revenue recognition practices. It was found that the company reported sales in a manner that did not align with generally accepted accounting principles. This practice raised alarms about the integrity of their financial statements. Investors relying on these reports were likely led to have an inflated sense of the company’s profitability and growth potential.

Furthermore, the investigation underscored a pattern of negligence in adhering to corporate governance standards, which are intended to ensure that companies provide a true and fair view of their financial condition. The findings suggest that internal controls at Coffee Day Enterprises were either inadequately designed or poorly implemented, leading to the lapses in financial reporting. This situation underlines the critical need for robust oversight mechanisms within corporations to prevent similar issues from arising in the future.

Impact on Shareholders and Investors

The recent imposition of a ₹38 lakh penalty by the Securities and Exchange Board of India (SEBI) on Coffee Day Enterprises has raised several concerns among shareholders and investors. Such regulatory actions can often lead to heightened uncertainty regarding the financial disclosures and operations of the company, which may, in turn, significantly impact investor sentiment.

Initially, the market reaction following the announcement of the penalty may exhibit volatility. Investors often respond to news of regulatory penalties with caution, as these can indicate deeper issues related to corporate governance and compliance within the organization. The uncertainty can lead to a decline in the stock price, reflecting a lack of confidence among existing and potential investors.

Furthermore, the lapse in financial disclosures raises questions about the overall transparency of Coffee Day Enterprises. Shareholders typically seek companies with clear, reliable communication regarding their financial health. A penalty of this nature may prompt current investors to reassess their positions in the company. They may feel compelled to sell their stakes to avoid potential losses, thereby exacerbating any downward pressure on the stock price.

On the other hand, long-term investors may view such penalties as a potential buying opportunity, particularly if they believe that the company can recover and improve its governance practices. However, this view hinges on the company’s ability to navigate through the aftermath of the penalty while restoring investor trust.

Ultimately, the impact of SEBI’s penalty on Coffee Day Enterprises will depend largely on how the company manages investor relations and addresses the concerns raised by its recent financial disclosure lapses. Strategic communication and transparent future disclosures will be critical in shaping a positive investor outlook moving forward.

Regulatory Framework and Compliance

The Securities and Exchange Board of India (SEBI) plays a critical role in regulating the securities market in India, serving to protect the interests of investors by enforcing compliance with established financial disclosure norms. These regulations are anchored in the principles of transparency, fairness, and accountability, guiding companies in the provision of accurate and timely information regarding their financial performance. For publicly listed companies like Coffee Day Enterprise, adherence to these guidelines is not merely a legal obligation but a cornerstone of maintaining investor trust and market integrity.

One of the key regulations enacted by SEBI pertains to insider trading and the necessity of transparency in financial disclosures. The requirement mandates that companies disclose their financial statements and significant events that may materially affect the financial conditions of the organization. Regular disclosures not only enhance the reliability of the market but also ensure that investors can make informed decisions based on the most up-to-date information.

In the case of Coffee Day Enterprises, the lapses in financial disclosure that led to a penalty of ₹38 Lakh raise important questions about compliance culture within the organization. Non-compliance with SEBI’s regulations can indicate deeper issues related to governance and accountability, undermining the company’s reputation and potentially eroding shareholder value. The importance of a robust internal financial control system cannot be overstated in this context, as it helps to ensure that all required disclosures are made accurately and on time.

Furthermore, SEBI continually updates its regulatory framework to adapt to evolving market conditions and expectations from stakeholders. Companies must remain vigilant in understanding and implementing these changes. The rigorous enforcement of compliance measures serves as a reminder that transparency in financial reporting is not just a regulatory requirement but a fundamental principle that contributes to the overall health of the financial ecosystem.

Response from Coffee Day Enterprises

Coffee Day Enterprises has publicly acknowledged the recent penalty imposed by the Securities and Exchange Board of India (SEBI) amounting to ₹38 lakh due to lapses in financial disclosures. In an official statement, the company emphasized its commitment to compliance with regulatory requirements and transparent reporting practices. Recognizing the gravity of the situation, the management indicated that it is reviewing the specifics surrounding the findings outlined by SEBI.

According to the company’s spokesperson, Coffee Day Enterprises is dedicated to rectifying any discrepancies that may have led to these lapses. The company aims to strengthen its internal processes to prevent any future issues related to financial reporting. In their response, they reassured stakeholders that they are taking the necessary steps to enhance their governance and compliance framework, which includes consulting with experts to ensure adherence to best practices in financial disclosure.

Additionally, Coffee Day Enterprises has assured investors that the financial impact of the penalties on its operations will be managed efficiently. They are committed to maintaining trust and confidence among shareholders by prioritizing accurate, timely, and complete financial statements. The company confirmed its intention to engage closely with SEBI and other regulatory bodies as they proceed with implementing improvements. Coffee Day has expressed optimism that these actions would mitigate any similar occurrences in the future.

In light of the severity of the situation, Coffee Day’s management is not only addressing the penalty itself but also prioritizing the establishment of a culture of compliance within the organization. The company sees this as an opportunity to reinforce and improve its financial governance, thereby ensuring stakeholders are consistently provided with accurate and reliable information.

Precedent for Future Cases

The recent imposition of a ₹38 lakh penalty by the Securities and Exchange Board of India (SEBI) on Coffee Day Enterprises for lapses in financial disclosure serves as a critical juncture in the landscape of corporate governance. It underscores the regulatory body’s commitment to enforce transparency and accountability within the financial reporting practices of publicly-listed companies. This ruling is not merely an isolated event but is poised to set a precedent for future actions against similar businesses that compromise on accurate financial disclosures.

As organizations navigate the complex regulatory environment, the SEBI’s decision signals the importance of adhering to established standards of financial reporting. Companies are now likely to reassess and enhance their internal controls and governance frameworks to ensure compliance. This case exemplifies a growing trend where regulatory bodies are poised to take strict actions against entities that fail to meet necessary disclosure requirements, particularly in an era marked by heightened investor awareness and demand for transparency.

Furthermore, the ruling might inspire similar regulatory actions against other firms within the industry. Stakeholders, including investors, advisors, and the general public, can expect increased scrutiny on financial statements and corporate disclosures. It encourages businesses to cultivate a culture of ethical compliance, where leadership prioritizes accurate reporting over short-term gains. The ramifications of this decision extend beyond just a financial penalty, as it could result in long-lasting changes to corporate governance practices across various sectors.

In light of the SEBI’s actions, firms must recognize the potential repercussions of financial disclosure lapses. As regulatory measures become increasingly stringent, it is imperative for businesses to foster an environment of transparency and ethical reporting to safeguard their reputation and operational integrity.

The recent ₹38 lakh penalty imposed by the Securities and Exchange Board of India (SEBI) on Coffee Day Enterprises has significant implications for the corporate landscape. This decision serves as a reminder of the crucial need for adherence to financial disclosure regulations and the overall importance of maintaining financial integrity within organizations. The lapses identified in the company’s financial reporting underscore the consequences of non-compliance with regulatory requirements, highlighting the responsibilities that companies have towards their stakeholders.

Financial integrity is not merely a regulatory obligation; it forms the backbone of trust between corporations and their investors, customers, and the broader public. When companies fail to provide accurate and timely financial information, they risk damaging their credibility and, ultimately, their market position. The actions taken by SEBI against Coffee Day Enterprises reflect a broader trend towards greater scrutiny of financial practices in the corporate sector. This approach aims to foster transparency and accountability, ensuring that companies operate within the regulatory framework designed to protect investors.

Moreover, this development emphasizes the urgent need for corporate governance frameworks that prioritize ethical practices and compliance. Executives, as leaders of their organizations, play a pivotal role in promoting a culture that values integrity and transparency in financial dealings. Failure to adhere to these principles can result in severe penalties and tarnish the reputation of the individuals and organizations involved.

In conclusion, the penalty levied on Coffee Day Enterprises serves as a vital lesson on the importance of robust financial reporting and regulatory compliance. Companies and their executives must recognize the critical need to uphold financial integrity, allowing for sustainable growth and fostering trust among all stakeholders involved.

Bharat Electronics Sets Record Date for Interim Dividend of ₹1.95 Per Share

Bharat Electronics Limited and its Financial Performance

Bharat Electronics Limited (BEL) is a prestigious state-run enterprise established in 1954, specializing in defense electronics. The company plays a vital role in India’s defense landscape by providing advanced technological solutions and systems to the armed forces. BEL is engaged in manufacturing a wide array of products such as radars, communication systems, and electronic warfare equipment, thereby significantly contributing to India’s self-reliance in defense technology.

With its headquarters in Bengaluru, BEL has established various manufacturing plants across India, which not only enhances production capabilities but also ensures proximity to major defense establishments. This strategic positioning allows BEL to be a key player in both domestic and international markets, exporting its products to several countries worldwide.

In terms of financial performance, Bharat Electronics Limited has demonstrated robust growth over the past few years. The company reported a significant increase in its revenues, largely attributed to rising demand for defense electronics amidst increasing defense budgets globally. For the fiscal year ending March 2023, BEL recorded a revenue growth of about 10%, reaching an impressive total of Rs 13,000 crores, showcasing its solid market position and operational efficiency.

The company’s net profit also surged, reflecting its effective cost management strategies and expanding order book. BEL’s commitment to innovation is evident in its substantial investment in research and development, which is crucial for maintaining a competitive edge in the rapidly evolving defense sector. Furthermore, BEL’s endeavors in diversifying its product range and enhancing capabilities in emerging technologies such as artificial intelligence and automation have positioned the company favorably for future growth.

Bharat Electronics Limited continues to be a cornerstone of India’s defense infrastructure, delivering vital technological solutions while also contributing significantly to the national economy. As it pursues further growth and innovation, BEL remains dedicated to supporting India’s defense modernization initiatives.

Bharat Electronics Limited (BEL), a public sector undertaking and a leading manufacturer of defense electronics, has recently announced an interim dividend of Rs 1.95 per share for the financial year 2025-26. This decision underscores the company’s commitment to providing returns to its shareholders while maintaining a robust financial strategy. The interim dividend will be distributed to all eligible shareholders, which is significant for those who have a vested interest in the company’s ongoing performance and profitability.

The timing of this dividend announcement aligns with BEL’s positive financial outlook, reflecting its sustained growth trajectory and sound management practices. For shareholders, the interim dividend represents a direct benefit, providing them with a portion of the company’s earnings, thereby enhancing their investment returns. This move not only rewards existing shareholders but also serves to attract potential investors looking for a stable income from their investments.

In terms of logistics, the interim dividend will be disbursed on a specified date, which will be communicated to shareholders well in advance. This ensures that stakeholders are adequately informed and can anticipate the influx of funds to their respective accounts, reflecting BEL’s commitment to transparency and shareholder engagement. Additionally, the declaration of the interim dividend indicates the company’s confidence in its operational performance and financial stability, suggesting that BEL is well-positioned to navigate market challenges while creating value for its shareholders.

It is worth noting that the interim dividend is part of a broader financial strategy aimed at balancing shareholder returns with reinvestment in business growth. By distributing a portion of profits, BEL not only maintains shareholder satisfaction but also affirms its ongoing efforts to strengthen its financial position and competitive advantage in the market.

Understanding the Record Date

The record date is a crucial concept in the context of dividend distribution, serving as a cut-off point that determines which shareholders are eligible to receive dividends announced by a company. In the case of Bharat Electronics Limited (BEL), the record date for the interim dividend of Rs 1.95 per share has been set for March 5. Shareholders who are recorded on the company’s books by this date will qualify to receive the announced dividend, which is particularly significant for those seeking to benefit from their investments.

For seasoned investors, the record date is a vital aspect of investment strategy. It allows for informed decision-making regarding buying or selling shares. Investors who wish to partake in the dividend must ensure ownership of the shares prior to the record date. Any purchases made on or after March 5 will not be eligible for the interim dividend. Consequently, understanding this date can influence investment timelines and decisions.

For new shareholders, the record date represents an important opportunity to maximize returns. New investors should be aware that owning shares before the record date guarantees their entitlement to the dividend payout. This knowledge can foster a more strategic approach to investing, particularly in a company like BEL that has a history of providing dividends. Being informed about such details not only enhances financial understanding but also ensures that shareholders can take full advantage of their investment opportunities.

In essence, the record date is more than just a date; it serves as a critical marker for ensuring eligibility to receive dividends, highlighting the importance of being proactive in managing investments. By recognizing the implications of the record date, both seasoned and new shareholders can better navigate their dividend entitlements and make informed financial decisions.

Future Outlook for Bharat Electronics Limited and its Investors

The recent announcement by Bharat Electronics Limited (BEL) regarding an interim dividend of Rs 1.95 per share has provided positive indications for the company’s future prospects. This dividend reflects not only the company’s robust financial health but also its commitment to returning value to shareholders. Such a move is typically perceived as a sign of confidence in enduring profitability and operational stability, particularly in a sector as crucial as defense.

Bharat Electronics plays a pivotal role in India’s defense and aerospace sectors, contributing to critical projects and innovations. The increasing government expenditure on defense modernization and self-reliance initiatives hints at a promising growth trajectory for BEL. Analysts are optimistic about the company’s potential to capitalize on emerging technologies and defense capabilities. Furthermore, the ongoing geopolitical dynamics underline the necessity for countries, including India, to enhance their defense systems, which could lead to increased contracts for companies like BEL.

Market reactions to the interim dividend announcement have been generally favorable, with investor sentiment reflecting a sense of reliability associated with BEL’s dividend-paying history. Experts suggest that this move should be seen as a strategically calculated decision by BEL’s management, showcasing transparency and fostering trust with investors. Additionally, many investment analysts regard BEL as a stable long-term investment, given its strong order book and gradual expansion into new technologies such as electronics for the defense and aerospace sectors.

With these factors in mind, investors should closely monitor Bharat Electronics Limited’s progression and activity within the defense sector. As the company navigates through evolving industry demands and technological advancements, its capacity to sustain growth and fulfill investor expectations remains optimistic. In summary, BEL’s recent dividend announcement serves as a significant indicator of its financial stability and growth potential, thereby positioning it favorably for both current and prospective investors.